
In case the support level of $0.022 hold, the Tron price will bounce to the north and the trader should seek the opportunity to set up a long trade
Key Highlights:
- There is a tendency for further TRX price reduction;
- bears may still take control of the market this week;
- Tron price may bounce to the north in case support level of $0.022 hold.
TRX/USD Price Long-term Trend: Bearish
Resistance levels: $0.026, $0.028, $0.031
Support levels: $0.022, $0.020, $0.018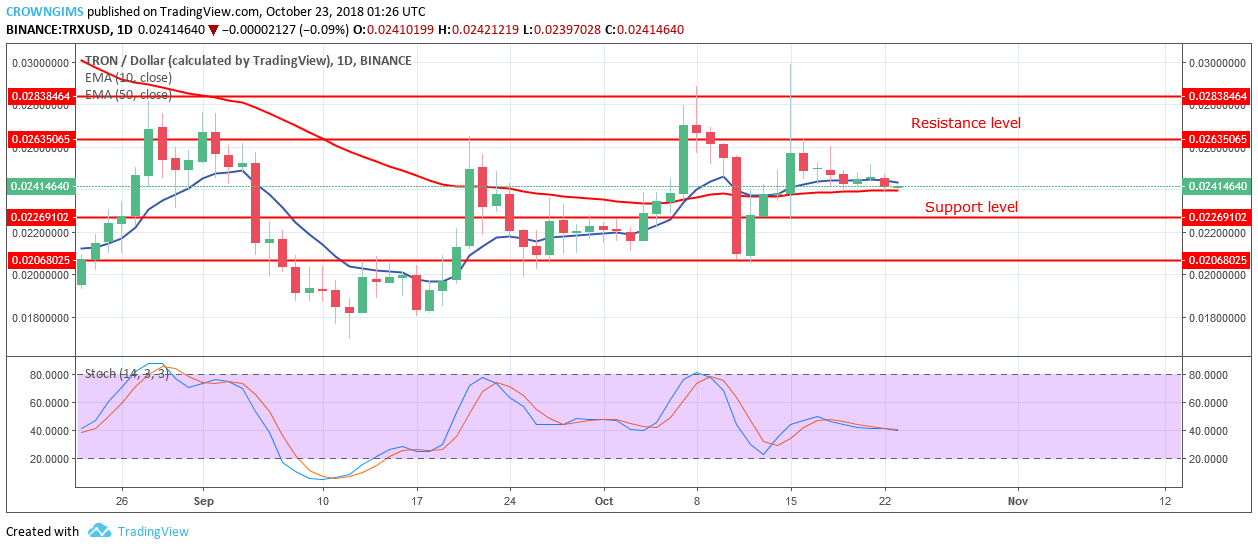

As at present, the price is falling toward the support level of $0.022. Tron is in-between the 10-day EMA and the 50-day EMA, while 50-day EMA is below the coin; which means there is a probability for further decrease of the TRX price to the support level of $0.022. In case the support level of $0.022 hold, the TRX price will bounce to the north and the trader should seek the opportunity to set up long trade, have your stop loss order below the support level of $0.22 and exit the trade at the resistance level of $0.026 or where the TRX price reverse.
The Stochastic Oscillator Period 14 on the daily chart is on the 40 level with the signal lines pointing to the south, indicating that Tron price may still decrease.
TRX/USD Price Medium-term Trend: Bearish
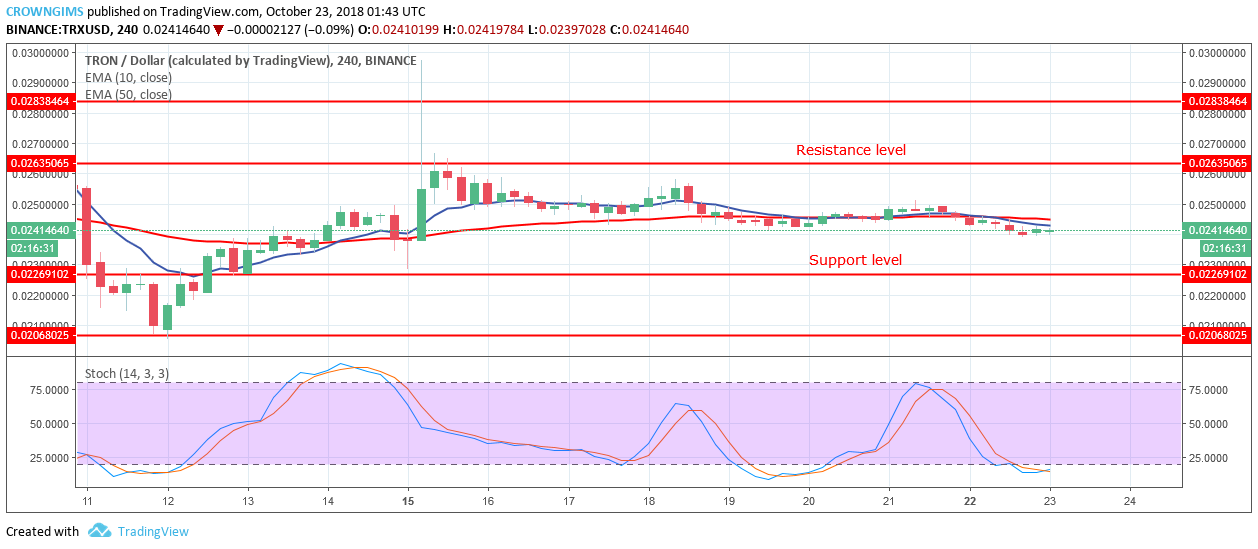
Currently, Tron is below 10-day EMA and the 50-day EMA; it indicates a continuation of downtrend movement.
In case, bears increase their momentum there is a probability that the price will experience further downtrend movement which may break the support level of $0.022. Nonetheless, the Stochastic Oscillator Period 14 is below 20level which is oversold region; there is a probability of price reversal.