
There is a probability that the Tron price will experience further downtrend movement which may break the support level of $0.021 and make the support level of $0.020 as the next target.
Key Highlights:
- The probability of further Tron price reduction is high;
- bears may still take control of the market this week;
- there may be price retracement.
TRX/USD Price Long-term Trend: Bearish
Resistance levels: $0.025, $0.028, $0.031
Support levels: $0.021, $0.020, $0.018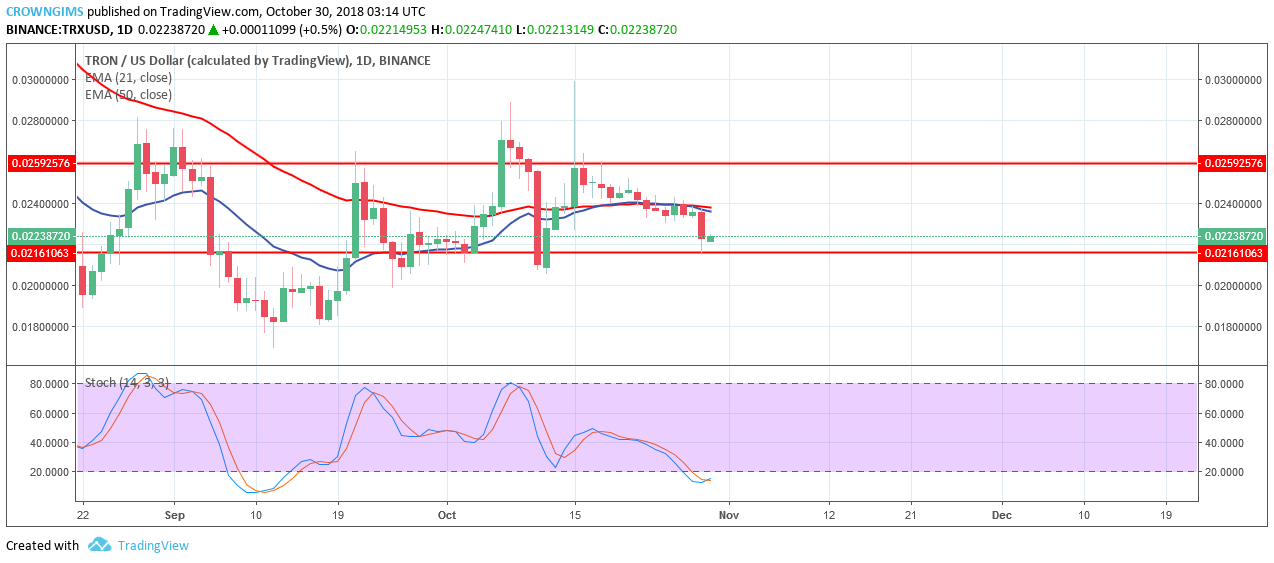

The coin is falling below the 21-day EMA and the 50-day EMA, an indication of bear’s pressure which means there is a probability for further decrease of the TRX price to the support level of $0.020 if $0.021 TRX price level is broken down side by the bears.
In case the support level of $0.021 hold, the TRX price will bounce to the north and the bulls will take over the market. The trader should seek the opportunity to set up long trade, have your stop loss order below the support level of $0.21 and exit the trade at the resistance level of $0.025 or where the TRX price reverse.
Meanwhile, the Stochastic Oscillator Period 14 on the daily chart is at the oversold region (below 20 levels) with the signal lines pointing to the north, indicating a buy signal.
TRX/USD Price Medium-term Trend: Bearish
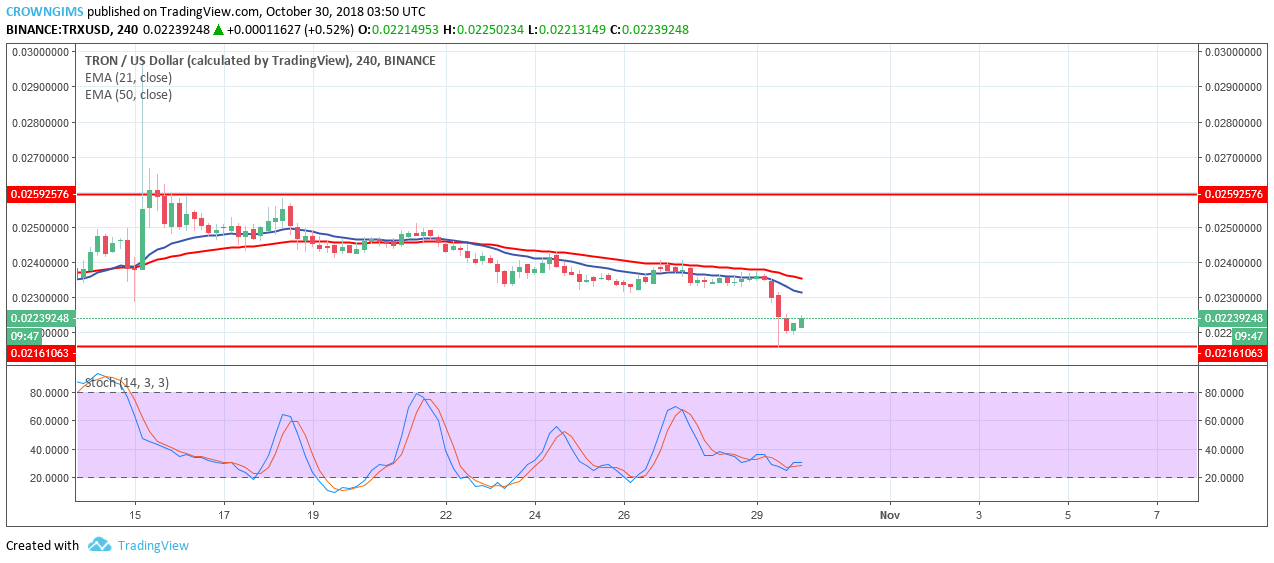
Presently, TRX price is below 21-day EMA and the 50-day EMA; it indicates a continuation of downtrend movement.
There is a probability that the price will experience further downtrend movement which may break the support level of $0.021 and make the support level of $0.020 as the next target. Nonetheless, the Stochastic Oscillator Period 14 is above 20level which is oversold region; there is a tendency for price retracement.
next