Tron (TRX) Price Analysis: Trends of October 9–15, 2018

On Oct 9, 2018 at 1:31 pm UTC by · 2 mins read

There is a probability for a breakout of the price from the resistance level of $0.028 in case the bulls increase their momentum.

Key Highlights:

  • There is a tendency for the price retracement;
  • in case bulls increase their pressure price will break out to the north;
  • traders should trade patiently with discipline.

TRX/USD Long-term Trend: Bullish

Resistance levels: $0.028, $0.031, $0.041
Support levels: $0.026, $0.024, $0.023Tron (TRX) Price Analysis: Trends of October 9–15, 2018The coin was bullish in its daily chart last week. The strong bearish pressure was lost after a drop in the price of the cryptocurrency to the lower support level of $0.024. The bulls took over the market from the bears, confirmed by the formation bullish engulfing candle. The price was pushed up to the supply level of $0.26 and broke out rallied to the resistance level of 0.028. It made an attempt to break this barrier at $0.028 but the Bears prevailed over the market pushed it back gradually; this could be a kind of retracement.

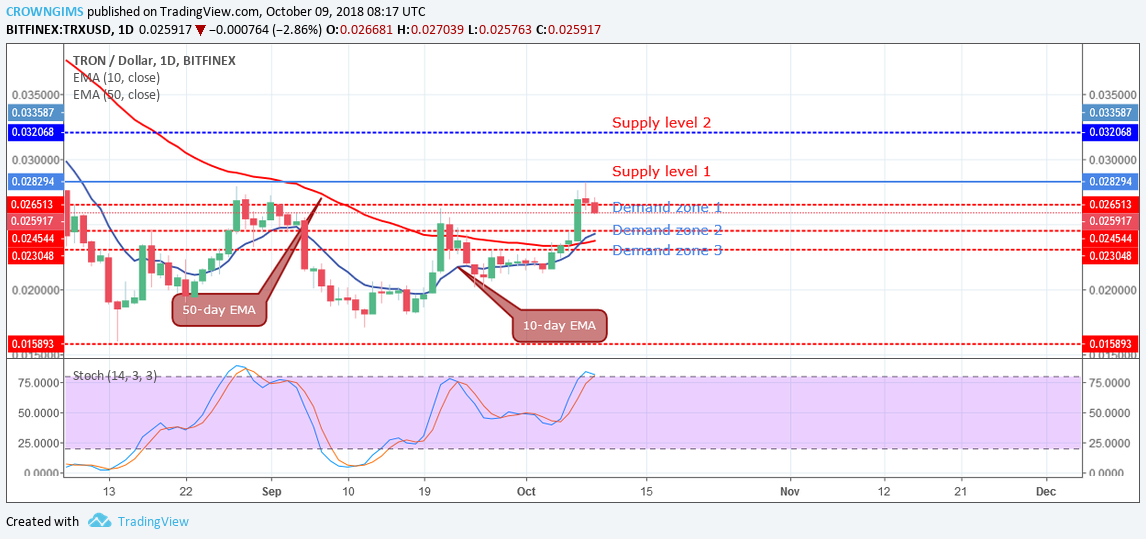
Currently, the price is retesting the resistance level of $0.26. The 10-day EMA is below the price while 50-day EMA is below the 10-day EMA; which means there is a probability for a breakout of the price from the resistance level of $0.028. Should bears increase their momentum, the break out may occur at the lower support level of $0.024.

The Stochastic Oscillator Period 14 on the daily chart is above the 80 level with the signal lines pointing to the south, indicating that price may decrease.

TRX/USD Price Medium-term Trend: Bullish

Tron (TRX) Price Analysis: Trends of October 9–15, 2018On the 4-Hour chart, the price was bullish last week. Bulls came in after the consolidation at the demand level of $0.021.There was enough momentum for the buyers to break the resistance levels of $0.24 and $0.26. The price headed towards the upper resistance level of $0.028 yesterday. The bears came in and gradually pushing the price downward.

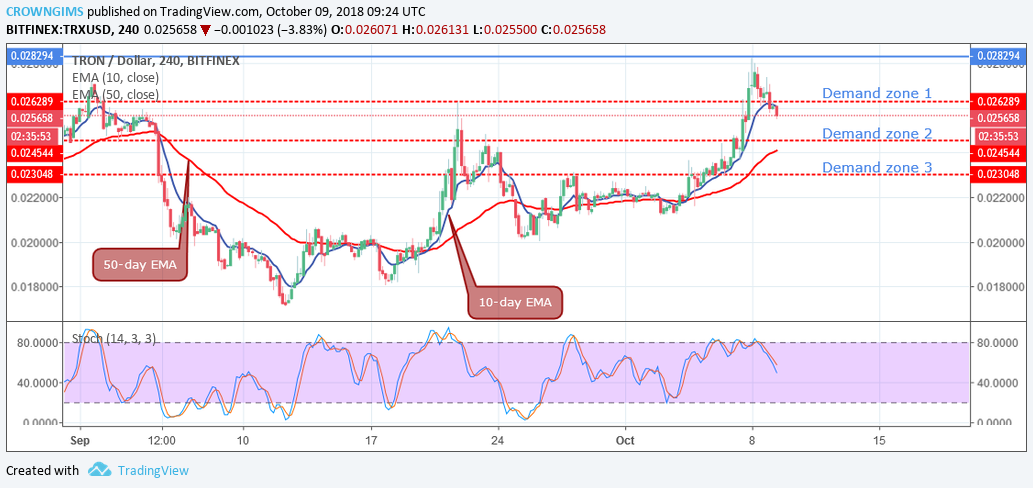
As at present the bears are in control of the market as the price is below 10-day EMA and the 50-day EMA below the price; it indicates that there could be a pullback movement before the continuation of an uptrend.

Should bears increase their momentum there is a probability that the price will experience downtrend movement towards the support level of $0.024. Nevertheless, the Stochastic Oscillator Period 14 is above 50 levels with the signal lines directed towards the south indicates a sell signal. Traders should trade patiently with discipline.

Share:

Related Articles

TRX Flips DOGE While TRON Races #8 Fueled by USDT Volume, IPO Momentum

By June 20th, 2025

TRON’s TRX has surpassed Dogecoin to claim the eighth position in cryptocurrency market capitalization rankings. The milestone comes as TRX benefits from increased USDT network activity and anticipation surrounding TRON’s upcoming public listing.

Tron MicroStrategy Stock Outperforms Alibaba and Tencent on Plans to Go Public

By June 17th, 2025

Justin Sun announced that SRM Entertainment, also referred to as Tron MicroStrategy, surpassed $1.8 billion in daily trading volume.

TRX Shifts to Buying Zone as SEC Acknowledges Staked Tron ETF Filing

By May 23rd, 2025

The SEC has acknowledged a proposed staked TRX ETF, as Tron trades flat at $0.274 while showing early signs of bullish momentum.

Exit mobile version