XRP has sparked fresh interest with a 3% daily price gain and a 120% volume surge, as it aims a breakout toward $2.70.
XRP XRP $1.31 24h volatility: 8.2% Market cap: $79.66 B Vol. 24h: $12.50 B has increased roughly 3% in the past 24 hours to trade around $2.21. The fourth largest cryptocurrency also saw a 120% spike in its 24-hour trading volume, according to CoinMarketCap data, hinting at renewed investor interest.
This increase aligns with broader market optimism. Bitcoin’s BTC $65 051 24h volatility: 7.9% Market cap: $1.30 T Vol. 24h: $161.96 B current path to $100,000, fueled by the Federal Reserve’s decision to hold interest rates, has boosted altcoin sentiment. Traders are rotating profits from BTC into assets like XRP, ETH ETH $1 914 24h volatility: 7.9% Market cap: $231.19 B Vol. 24h: $70.92 B , and SOL SOL $79.60 24h volatility: 11.4% Market cap: $45.15 B Vol. 24h: $14.32 B .
XRP saw a massive fivefold rally after Donald Trump’s presidential win in November 2024, achieving a local peak at $3.27 in January.
Since then, the crypto has been stuck in a tight range between $2.06 and $2.60. Nearly 70% of all volume has been exchanged within this corridor, pointing to strong accumulation.
Renowned crypto analyst Rishad remarked on X that XRP is “chilling near a strong buy zone” and “starting to wake up.” He explained that the $2 level remains a critical buy zone, with further support at $1.90 and $1.44.
Good Morning 🌅 $XRP chilling near a strong buy zone and starting to wake up. If it breaks that weak resistance, we could see a nice move up.
$2 is a good spot to place buys. If it drops, watch $1.90 and $1.44.
Still looks bullish mid-term $2.70+ could be next. Let’s see what… pic.twitter.com/E4POZWbLH4
— RisHad (@CryptoRisHad) May 8, 2025
The analyst added that a breach of the $2.20–$2.30 resistance zone could lead to major upside momentum, potentially targeting the $2.70 level in the medium term.
XRP Price Outlook
On the daily XRP price chart, Bollinger Bands have recently started tightening, hinting at a potential breakout. Price is now pressing the mid-band (20-day SMA), suggesting bullish pressure is building.

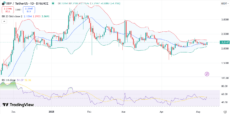
XRP price chart with RSI and Bollinger Bands indicators | Source: Trading View
The RSI stands at 54, suggesting that momentum is slightly bullish but not yet overbought. A sustained RSI push above would confirm buyer dominance. If XRP breaks above the $2.30, the next resistance lies at $2.60.
Meanwhile, the MACD is exhibiting a possible crossover just above the zero line, a sign of early positive momentum. However, a breakdown below $1.90 would invalidate the bullish structure and may trigger a further downfall.

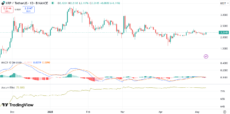
XRP price chart with MACD and Acc/dist indicators | Source: Trading View
The Accumulation/Distribution line continues to rise, showing that despite price stagnation, smart money has quietly been poured into XRP.
next