
Bitcoin slid to $63,414 as a one-in-three Fed rate hike probability and $465M in ETF outflows erased July’s fragile recovery gains.
Bitcoin fell as much as -3% to $63,100 on July 28, its lowest level in 11 days, as traders assigned roughly a one-in-three probability to a surprise Federal Reserve rate hike at the July 29 FOMC meeting.
This would compound a crypto sell-off already strained by more than $465M in US spot Bitcoin ETF outflows recorded on July 23 and 24, as well as yesterday’s (July 27) modest -$11M outflow.
This is not simply a Bitcoin-specific repricing. It is a macro de-risking event in which rate expectations are the operative variable, and the ETF flow data confirms that institutional participants moved first.
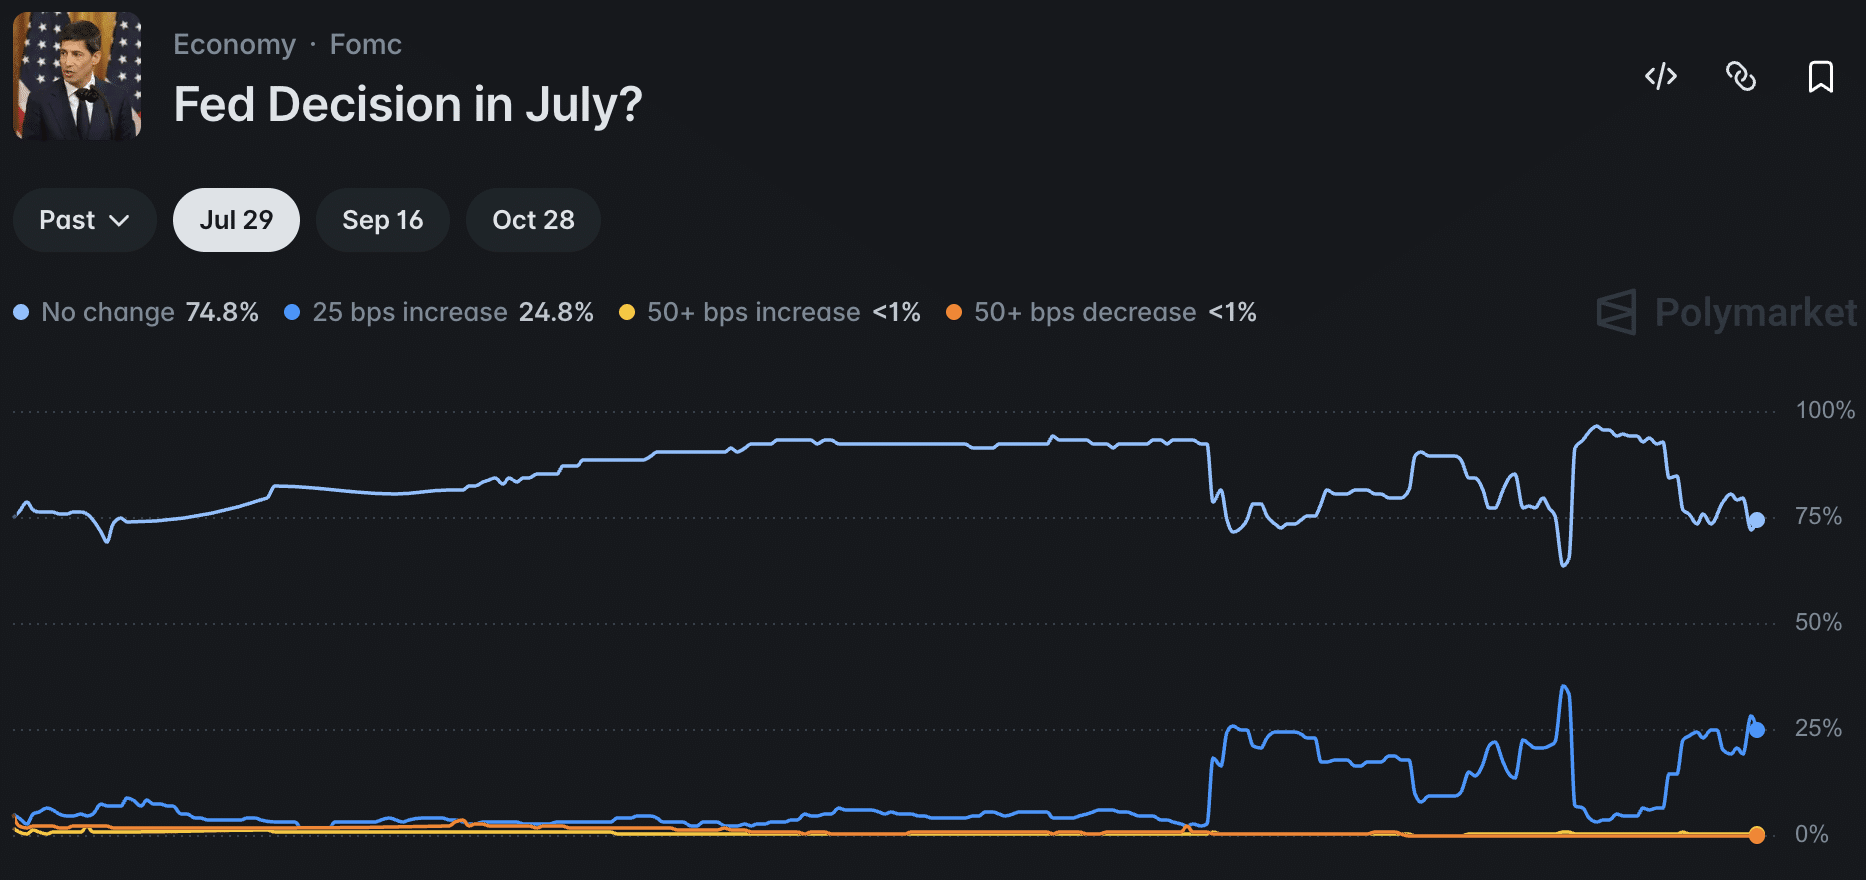

Fed Rate Decision Mechanics: How a One-in-Three Hike Probability Moves BTC Price
The mechanism functions as follows: rising rate expectations increase the opportunity cost of holding non-yielding risk assets, prompting systematic and discretionary managers to trim exposure ahead of the FOMC decision.
Citadel Securities has forecast a 25 basis-point hike on July 29, characterizing it as a move that would strengthen Federal Reserve Chair Kevin Warsh’s credibility in the inflation fight – a framing that, even if the hike does not materialize, anchors the hawkish read of the meeting.
The ETF outflow figure is the cleaner signal of institutional conviction. The $465M in outflows over July 23–24 snapped a seven-session inflow streak that had provided much of the price support during Bitcoin’s modest July recovery.
That recovery was itself fragile: Bitcoin had been clawing back ground after crashing roughly 50% from its October 2025 all-time high of $126,000, and the $65,000–$65,500 resistance band had capped multiple rally attempts before this week’s slide.
The rate-hike concern is also overshadowing recent legislative momentum. The Clarity Act, a long-awaited US cryptocurrency market-structure bill, had provided a degree of positive sentiment through mid-July, but that tailwind has been neutralized by the macro repricing ahead of the FOMC.
$BTC failed to hold the $65,000 level.
This happened as the Senate put the Clarity Act on hold.
Now, the next key support level for Bitcoin is $62,000-$65,000.
This should hold, or else BTC will end up giving all the gains. pic.twitter.com/CVFjOqdY4Q
— Ted (@TedPillows) July 28, 2026
Analyst Positioning: Key Levels and the 200-Day Moving Average Threshold
Caroline Mauron, co-founder of Orbit Markets, said Bitcoin is “mainly getting hit by the rising probability of a Fed hike, as well as macro concerns about AI-related credit risks,” identifying $62,000 as the next downside level to watch, with strong support expected around $60,000.
Both thresholds sit below the current spot price and represent the market’s near-term stress-test zones if the FOMC delivers the surprise hike Citadel Securities has penciled in.
Tony Sycamore, analyst at IG Australia, described the current stance as a neutral bias on Bitcoin, noting that a sustained break and close above the 200-day moving average at $72,001 is still required to negate medium-term downside risks and allow a more constructive technical picture to emerge.
That level is roughly 13.5% above the July 28 intraday low, a gap that underscores how much structural repair remains before trend-following buyers return in size.
On-chain dynamics add a further layer to the structural read. The broader drawdown from the $126,000 peak has been accompanied by long-term holder capitulation and accelerated coin movement to exchanges, patterns consistent with forced rather than discretionary selling, as detailed in CoinSpeaker’s analysis of long-term holder behavior during Bitcoin’s decline.
DISCOVER: Best Meme Coins to Buy in 2026
Bull and Bear Scenario Framing: What the FOMC Decision Changes
REMINDER: 🇺🇸 The FOMC decision is tomorrow, and every serious investor MUST watch it.
Rate decision: 2:00 PM ET
Kevin Warsh press conference: 2:30 PM ETMarkets price a nearly 40% chance of a surprise hike.
One decision could move stocks, crypto, bonds, and the dollar at once.… https://t.co/zooN8GEt1a pic.twitter.com/kpeLEUDNrN
— Crypto Rover (@cryptorover) July 28, 2026
The confirmatory condition for stabilization is straightforward: a Fed hold accompanied by dovish-leaning language would remove the principal macro headwind and allow attention to return to the Clarity Act and spot ETF demand. In that scenario, the $65,000–$65,500 resistance band becomes the near-term target for any recovery bid.
The bearish path runs through the Mauron support levels. A confirmed 25bp rate hike would likely accelerate ETF outflows beyond the July 23–24 pace, increasing the probability of a test of $60,000, a round-number level that has historically attracted both retail buyers and options market activity.
We suspect the realized P&L distribution at that level, heavily weighted toward buyers from the post-$100,000 correction phase, makes a clean break below $60,000 structurally difficult without a secondary macro shock.
The analytical question is no longer whether Bitcoin is in a medium-term downtrend – the 200-day moving average gap settles that. It is whether the FOMC outcome on July 29 triggers another wave of ETF redemptions or gives the fragile July recovery enough room to resume.
EXPLORE: Best Meme Coins to Buy for August
next