
Bitcoin spot ETFs have logged $149 million in inflows despite a price dip, showing that accumulation remains steady.
Bitcoin spot ETFs attracted $149 million in net inflows on October 27, marking the third consecutive day of positive institutional demand despite a recent price drop. Ethereum ETFs followed closely, pulling in $134 million with no outflows across all nine funds.
Meanwhile, according to CoinMarketCap, the broader market remains cautious with the Fear and Greed Index reading neutral at 42.
On October 27, Bitcoin spot ETFs recorded a total net inflow of $149 million, marking their third consecutive day of inflows. Ethereum spot ETFs saw a total net inflow of $134 million, with no net outflows among the nine funds.https://t.co/Hj2Gs49bWa pic.twitter.com/GIFVx5L9UK
— Wu Blockchain (@WuBlockchain) October 28, 2025
Binance Data Points to Smart Accumulation
According to on-chain data from CryptoQuant, Bitcoin BTC $70 667 24h volatility: 0.5% Market cap: $1.41 T Vol. 24h: $26.54 B has been trading in a defined range for around 120 days, forming what analysts describe as a phase of “smart accumulation.”
The Spot-to-Perpetual Volume Ratio on Binance, which is a key measure of genuine spot demand, has remained elevated and stable, indicating that real buyers are holding their positions rather than exiting.
Cryptoquant analysts stated that if the ratio rises further alongside a price breakout, it would confirm a new bullish leg driven by strong spot demand.
Market Structure and On-Chain Stability
Glassnode’s latest report revealed that Bitcoin’s price has stabilized following the earlier drawdown, as the RSI has rebounded from oversold levels, while both Spot and Perpetual CVD metrics show easing sell pressure and renewed buying activity.
Derivatives data shows reduced leverage and a more balanced market, with open interest declining and funding rates turning positive, indicating that traders are opening long positions.
Options activity remains strong, but overall spot volumes have dropped. On-chain data also shows quieter network activity, with lower transaction volumes and active addresses, which indicates consolidation, according to Glassnode.
Bitcoin Price Analysis: What’s Next for BTC?
Bitcoin currently trades near $114,143, having bounced from its lower Bollinger Band and the strong support zone between $104,500 and $109,500. The upper resistance lies around $118,600.
The RSI at 53.2 indicates a neutral stance, while the Chaikin Money Flow (CMF) at -0.05 reveals that inflows and outflows are nearly balanced.
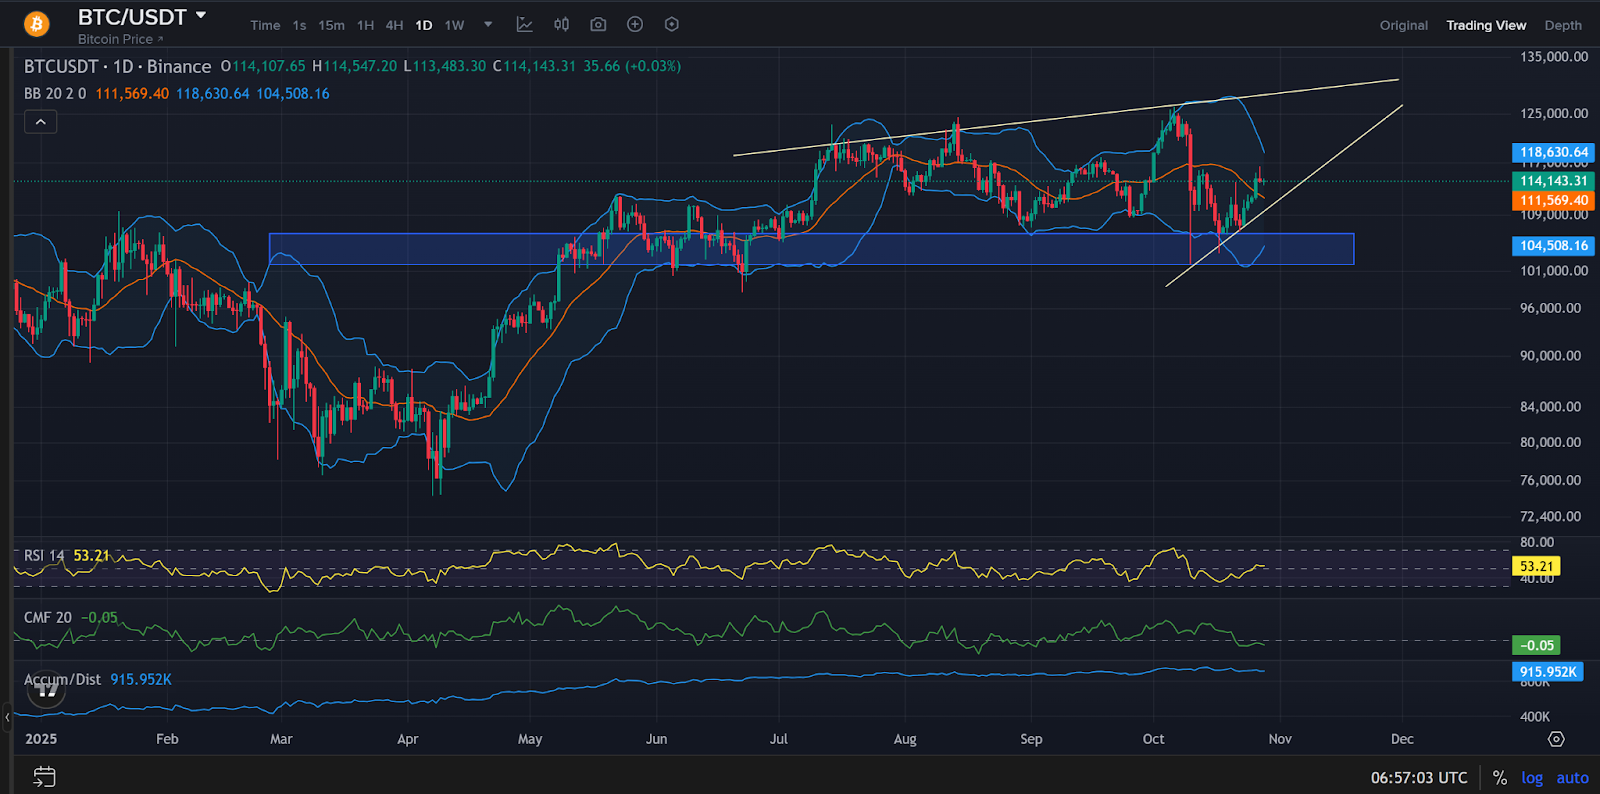

If Bitcoin’s structure remains intact within the ascending structure, a break above $118,600 could open the path to $125,000. However, a drop below $109,000 could trigger a retest of $104,500, a demand zone for BTC.
next