
Large Bitcoin holders are doubling down on accumulation while mid-sized and retail investors ease selling, fueling optimism for a bullish continuation.
Bitcoin (BTC) is trading steady around $84,500 after weeks of volatility that rattled investor sentiment. On-chain data from Glassnode points out that wallets holding over 10,000 BTC continue to demonstrate strong accumulation behavior.
Meanwhile, investors holding between 10 and 100 BTC, usually considered mid-sized investors, are also shifting toward accumulation after months of distribution.
Whales holding >10K $BTC maintain a strong accumulation trend (~0.7), continuing to lead the market. Smaller cohorts – from <1 $BTC to 100 $BTC – are easing off their distribution, with the 10–100 $BTC group now hovering around 0.5, hinting at a potential pivot toward… pic.twitter.com/DOYWAMch0G
— glassnode (@glassnode) April 18, 2025
Interestingly, data reveals that smaller cohorts are easing their sell-offs too, hinting that selling exhaustion might be setting in.
Bullish Continuation Ahead?
Glassnode’s weekly insights noted the absence of expanding unrealized losses among long-term holders. Historically, spikes in these losses have correlated with bear market confirmations. So far, this signal remains dormant, sending hope to bulls.
Popular crypto analyst Ali Martinez also echoes the bullish sentiment, revealing that over 15,000 BTC have been withdrawn from centralized exchanges in the past week. This flow into cold storage suggests that investors are preparing for a bullish continuation.
Over 15,000 #Bitcoin $BTC have been withdrawn from exchanges in the past week! pic.twitter.com/hXmnnb17er
— Ali (@ali_charts) April 18, 2025
As Glassnode reported on April 17, Bitcoin’s realized cap has hit a fresh all-time high of $872 billion. However, the rate of inflow is showing signs of fatigue, suggesting a weak appetite from newer entrants and institutional buyers alike.
#Bitcoin’s realized cap has reached an all-time high of $872B, yet monthly growth has slowed to +0.9%. This indicates that while capital inflows remain positive, investor appetite is softening – signaling continued risk-off sentiment. pic.twitter.com/XBgZP7NoWo
— glassnode (@glassnode) April 17, 2025
BTC Price Outlook
On the daily BTC price chart, the RSI is currently at 52. This leaves room for price action in either direction. An RSI dip below 47 would tilt momentum back to the bears, possibly dragging BTC to test support near $80,000 and then $76,000.

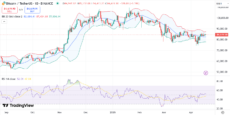
BTC price chart | Source: Trading View
Bollinger Bands have significantly tightened with price hovering near the upper band, around $84,600. A sustained hold above the middle band (20-day SMA) at $84,600 could trigger a move toward $90,000.
However, traders could see significant resistance in the $87,000–$88,500 region.
Meanwhile, the blue MACD line is currently above the orange signal line with green histogram bars. This also indicates that short-term momentum is upward.

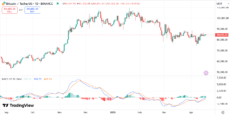
BTC price chart | Source: Trading View
It is important to note that BTC recently broke out from a 5-month long descending wedge pattern, further confirming the bullish shift.
However, popular analyst Crypto Ceaser explains that breaching the EMA50 (Exponential Moving Average – 50 day) remains critical to confirm a long-term bullish reversal. The key resistance zone near $87,000 must be reclaimed for the bulls to regain decisive control.
It’s important for $BTC – #Bitcoin to break the EMA50. pic.twitter.com/eG4lJ3B6jL
— Crypto Caesar (@CryptoCaesarTA) April 17, 2025