Bitcoin Price Analysis: BTC/USD Price Reversed at $7,600, Heading Towards $8,235

On Jun 5, 2019 at 10:37 am UTC by · 2 mins read

More pressure from the Bears after the pullback will decrease Bitcoin price further, which may break $7,600 level and target $7,195 level. Should the Bulls defend the demand level of $7,600 the coin may target $8,235 level.

Key Highlights:

  • Bitcoin price reversed at $7,600 level;
  • the Bulls may take over Bitcoin market fully;
  • the price is heading towards $8,235 level.

BTC/USD Medium-term Trend: Bearish

Resistance levels: $8,235, $9,398, $10,168
Support levels: $7,600, $7,195, $6,856Bitcoin price turned Bearish on the medium-term outlook. Bitcoin was consolidating on the dynamic support and resistance level last five days. The Bulls momentum was weak and the Bears prevailed over the bulls with the formation of strong massive bearish candle that broke down the Dynamic resistance and support level, passed through the barrier at $8,235 level and the price bottomed at $7,600 support level yesterday. At the opening of the market today on 4-hour chart, a bullish candle emerged which may serve as a pullback for Bitcoin price before the continuation of a bearish trend.

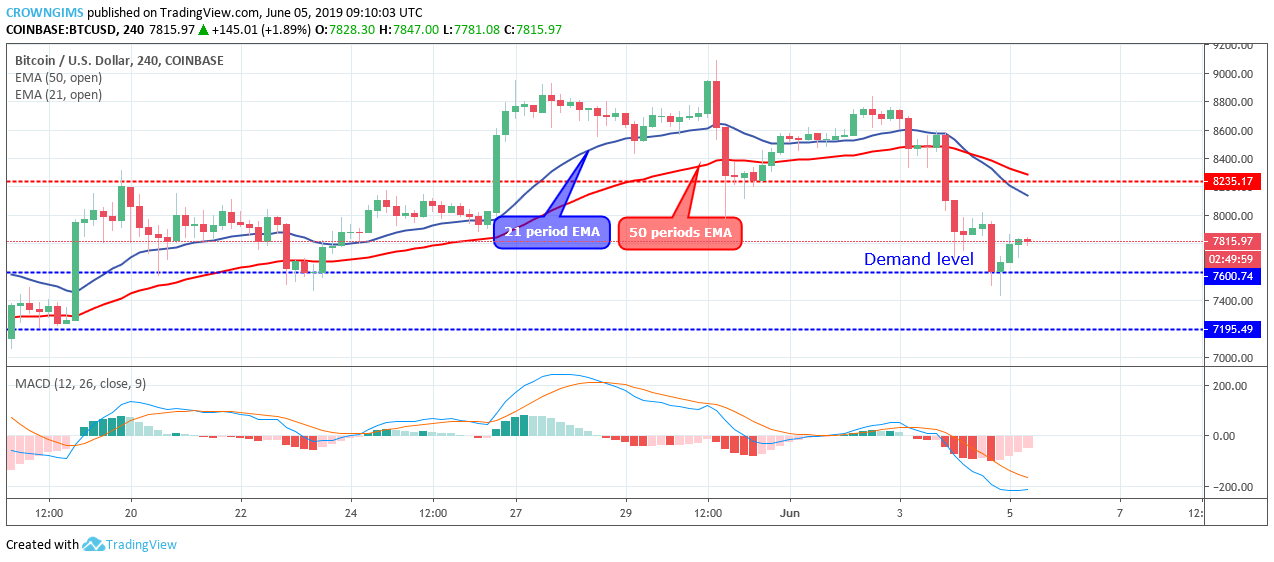
The 21-period EMA has crossed the 50 periods EMA downside as a sign of bearish momentum in the Bitcoin market. The crypto is trading below the two EMAs. The Moving Average Convergence Divergence period 12 is below zero levels and the signal lines bending down to indicate sell signal.

More pressure from the Bears after the pullback will decrease Bitcoin price further, which may break $7,600 level and target $7,195 level. Should the Bulls defend the demand level of $7,600 the coin may target $8,235 level.

BTC/USD Short-term Trend: Bearish

BTC/USD is Bearish on the short-term outlook. On the 1-hour chart, the coin is under the bearish pressure. The Bearish momentum came in to play after the Bulls lost their momentum at the dynamic support and resistance level. The price dropped to the level below $7,600. A tweezer bottom candle produced yesterday is a bullish reversal candle pattern; this is what brought about a reversal of the price towards $8,235 level.

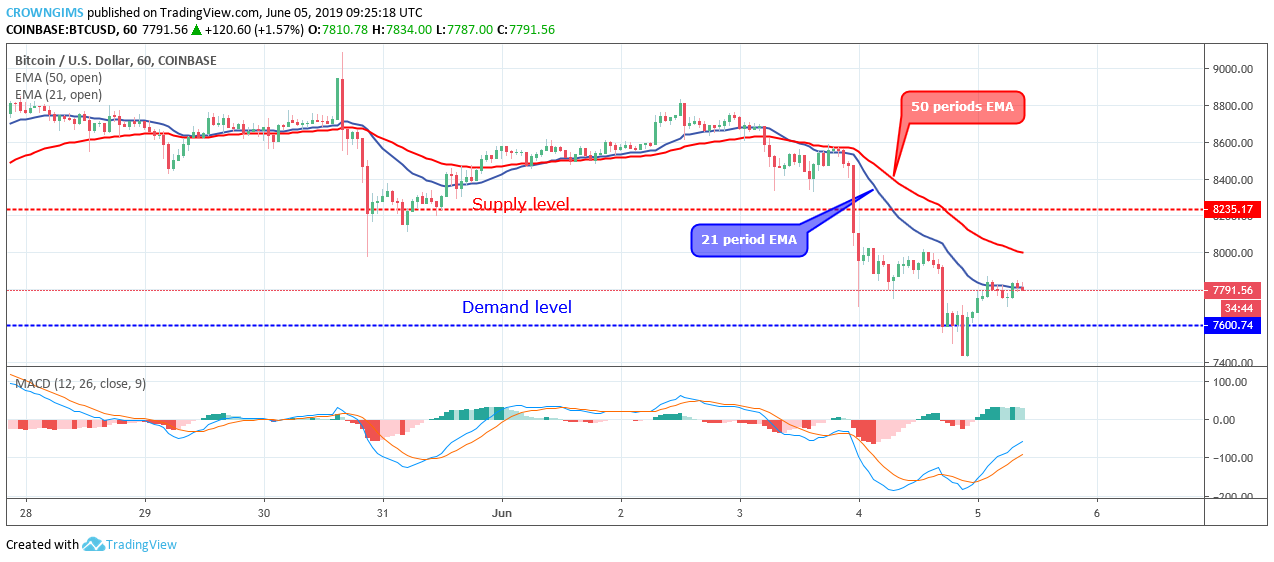
Meanwhile, MACD period 12 and its histogram are above zero level and the signal line pointing up to indicate a buy signal.

Share:

Related Articles

Bitcoin Hits ‘Deep Value’ as RSI Plummets to 23: Is the High-Conviction Bottom In?

By February 13th, 2026

Bitcoin RSI Hits 23: Analysts Flag ‘Deep Value’ Entry Point

Bitcoin Price Prediction: New Bitcoin Protocol Upgrade Makes BTC More Quantum-Resistant – $1 Million BTC Possible Now?

By February 12th, 2026

Bitcoin’s march toward becoming a global reserve asset has faced one persistent existential question: What happens when quantum computers become powerful enough to crack its cryptography? A new proposal, BIP-360, aims to answer this, potentially clearing the final hurdle for institutional adoption. But is $1 million a real possibility for Bitcoin? For now, the first […]

Robert Kiyosaki Sells Bitcoin and Gold as Crypto Market Loses $750B

By February 6th, 2026

Since Oct. 10, 2025, Bitcoin’s price has fallen about 44%, but US spot Bitcoin ETFs have reduced their BTC holdings by only 6.6%, showing major strength.

Exit mobile version