Bitcoin Price Analysis: BTC/USD Price Facing $5,840, Potential Bounce Zone

On May 6, 2019 at 10:23 am UTC by · 2 mins read

Further increase in the Bears’ momentum will make Bitcoin price break down the $5,946 level and even $5,840 level and target $5,716 price level. In case the Bulls defend $5,840 level Bitcoin price may bounce and rally towards $6,151 level.

Key Highlights:

  • The Bears are gradually taking over the Bitcoin market;
  • the breakdown at $5,946 level will expose $5,840 support level;
  • the Bitcoin price may bounce at $5,840 level.

BTC/USD Medium-term Trend: Bullish

Resistance levels: $5,978, $6,151, $7,271
Support levels: $5,840, $5,716, $5,574On the medium-term outlook, BTC/USD remains bullish. There was an increase in the Bulls momentum which broke up the Bitcoin level at $5,716 and the resistance level of $5,910. The Bullish trend extended up to $6,151 level on May 03, it pulled back and on the May 04 it retested the level. The resistance level of $6,151 has been tested three times. The Bears defended the level and Bitcoin price was rejected at the level. Currently, the price is at $5,951 level.

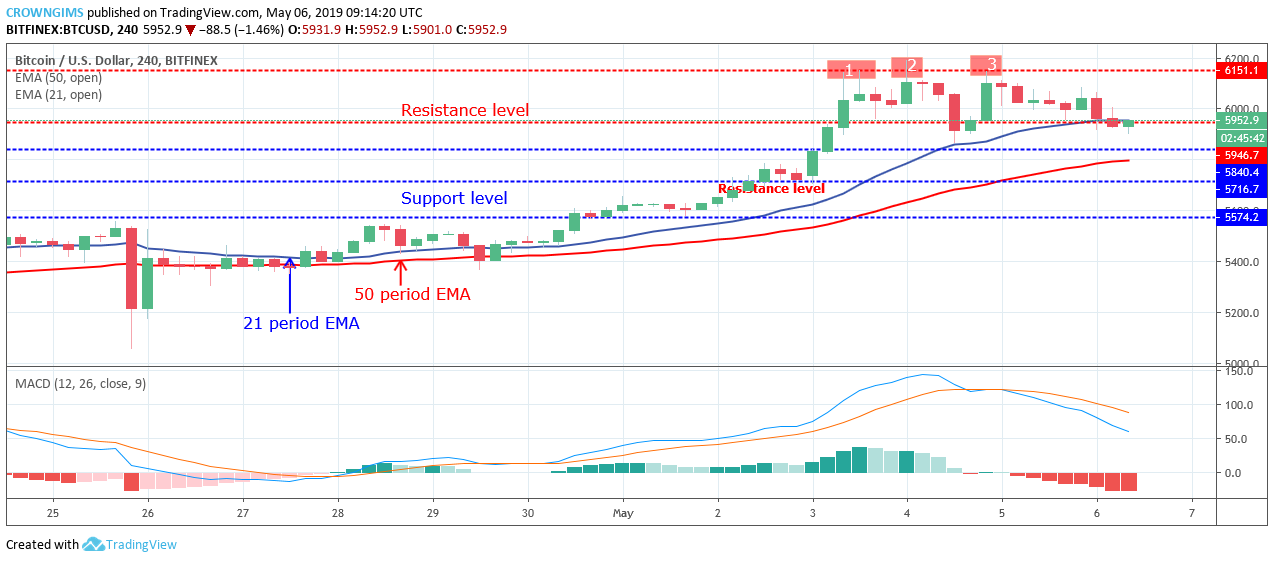
Bitcoin price and the 21 periods EMAs are in touch. Bitcoin is trading in between the 21 period EMA and 50 periods EMA currently; this indicates that the Bears are gradually taking over the BTC market.

The Moving Average Convergence Divergence period 12 with its histogram is below zero levels and the signal lines pointing down to indicate sell signal and a further reduction in BTC price.

Further increase in the Bears’ momentum will make the Bitcoin to break down the $5,946 level and may as well break down the $5,840 level and target $5,716 price level. In case the Bulls defend $5,840 level, Bitcoin price may bounce and rally to the north.

BTC/USD Short-term Trend: Bullish

BTC/USD is bullish on the short-term outlook. Bitcoin price reversed at $6,151 supply level after touching the level three times. The price is currently moving down towards $5,840 level. The 21-period EMA is bending towards 50 periods EMA to cross it down as a bearish trend sign and the coin below the two EMAs.

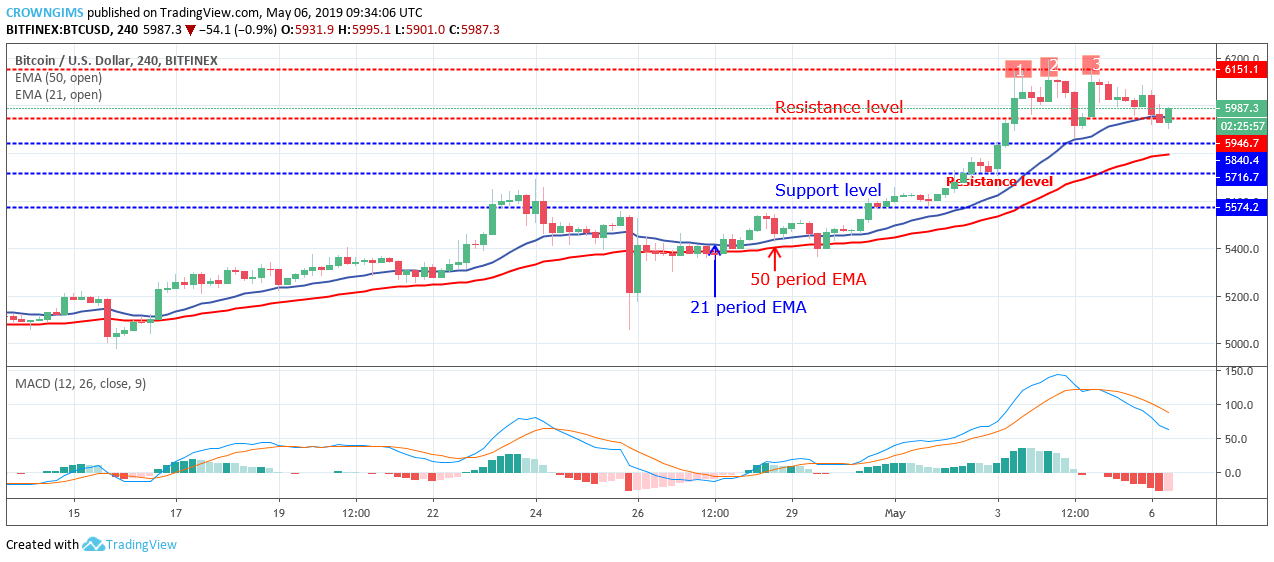
The MACD with its histogram is below zero levels as a selling signal. In case the $5,946 level holds, Bitcoin price may bounce and rally towards $6,151 level.

Share:

Related Articles

Michael Saylor Hints at Strategy’s 100th Bitcoin Purchase Milestone

By February 23rd, 2026

Michael Saylor Hints at Strategy’s 100th Bitcoin Purchase

Bitcoin Hits ‘Deep Value’ as RSI Plummets to 23: Is the High-Conviction Bottom In?

By February 13th, 2026

Bitcoin RSI Hits 23: Analysts Flag ‘Deep Value’ Entry Point

Bitcoin Price Prediction: New Bitcoin Protocol Upgrade Makes BTC More Quantum-Resistant – $1 Million BTC Possible Now?

By February 12th, 2026

Bitcoin’s march toward becoming a global reserve asset has faced one persistent existential question: What happens when quantum computers become powerful enough to crack its cryptography? A new proposal, BIP-360, aims to answer this, potentially clearing the final hurdle for institutional adoption. But is $1 million a real possibility for Bitcoin? For now, the first […]

Exit mobile version