
Bitcoin’s on-chain data reveals a bullish yet cautionary environment, as profit metrics approach euphoric levels but demand momentum weakens.
Bitcoin’s recent move above the $94,000 range has sparked discussions of a possible parabolic shift, especially as on-chain metrics show signs of approaching euphoria.
One such metric, the “supply in profit,” has now rebounded above 85%, inching close to a major 90% threshold. Historically, this level has acted as a trigger point, tipping market sentiment into a euphoric region.
Bitcoin Supply in Profit Approaching a Historic Euphoria Threshold
“Historically, when the supply in profit surpassed the 90% threshold, it consistently triggered euphoric phases, and we are now approaching that level” – By @Darkfost_Coc pic.twitter.com/FpbvsOxXsY
— CryptoQuant.com (@cryptoquant_com) April 29, 2025
However, it is important to note that while it fuels price rallies, it can also precede intense profit-taking. The recent correction saw the supply in profit dip close to 75%, brushing the global average in a bell curve distribution.
If the metric falls below this zone, panic selling or even a mini capitulation event could happen. That said, the current bounce back to 85% reflects resilience in the market, especially among mid-to-long-term holders.
Data from CryptoQuant reveals that whale wallets, those holding between 1,000 to 10,000 BTC, have seen their unrealized profits climb by nearly 38% to $150 billion since April-start.
Historically, the $200 billion mark has led whales to sell portions of their holdings, which often slows Bitcoin’s momentum. Notably, the market is not quite there yet.
Meanwhile, miners are capitalizing on the latest price increase. According to crypto analyst Ali Martinez, over 943 BTC, worth roughly $850 million, were sold in the last 12 days. This activity suggests a cautious sentiment as price nears the psychological $100,000 mark.
Bitcoin May Face Resistance Ahead
As per CoinMarketCap, BTC has added over $130 billion to its market cap this past week, climbing roughly 7.5%. Despite this, the cryptocurrency’s 30-day Demand Momentum remains in the red.
The current momentum sits at -483,860 BTC while the 30-day simple moving average (SMA) hovers around -310,700 BTC. This indicates that short-term demand has waned as more BTC is being sold than absorbed.
This dynamic is common in late bull cycles or during macro consolidation phases. For the trend to sustain, a reversal into positive demand territory is important. Until then, Bitcoin may face resistance without strong buying pressure.
Yet, behind the scenes, the indicators tell a more nuanced story, one of potential, but also of fragility.
BTC Price Outlook
On the daily chart, BTC price is hovering just below the upper band of the Bollinger Bands. A breakout above this level could ignite further upside momentum, targeting $100,000.
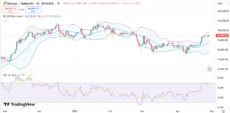

However, if the price falls and fails to sustain above the middle band (20-day SMA), traders could see a pullback.
Meanwhile, the RSI is sitting around 67, approaching overbought territory. A further upward move in the indicator could trigger a correction, but sustained consolidation above the level 60 is generally bullish.
next