
In case the demand zone of $0.075 holds, the price will bounce to the north and break the strong supply zone of $0.080, Cardano price will resume its uptrend movement towards the supply zone of $0.088.
Key Highlights
- There are possibilities for further downtrend;
- Cardano price may continue its bullish movement;
- traders should look out for buy stops to initiate long trades.
ADA/USD Price Long-term Trend: Bearish
Supply Zones: $0.080, $0.088, $0.094
Demand Zones: $0.075, $0.071, $0.065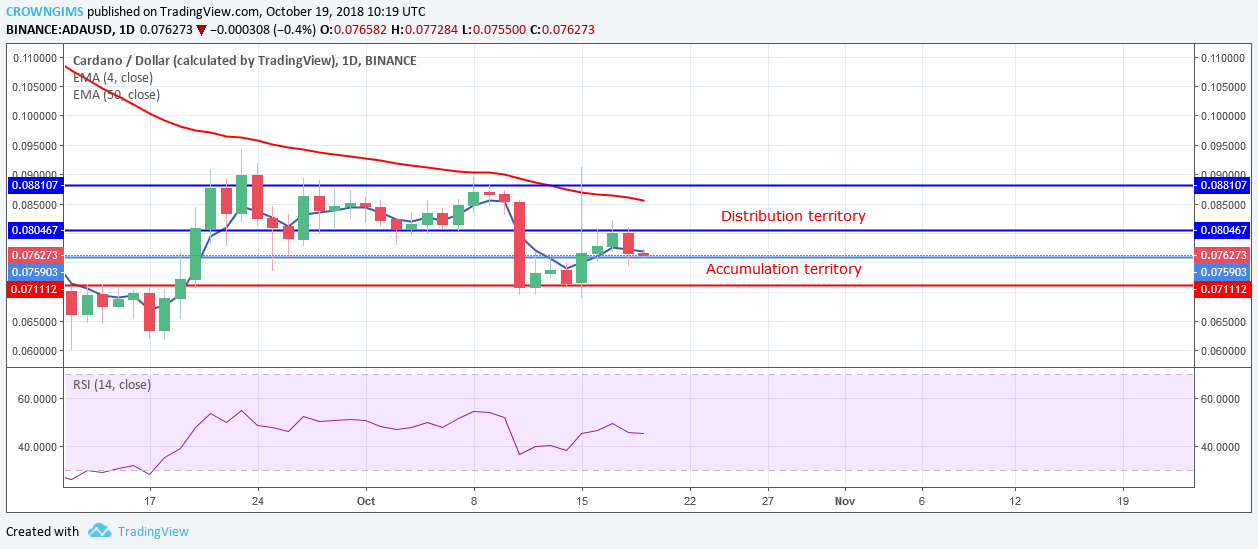

On October 15, the bulls enter the market with high momentum and pushed the pair to the north with the formation of massive bullish candle that broke the supply zones of $0.080 and $0.088 and exposed the supply zone of $0.094. The continuation of uptrend movement was rejected by the bears’ strong momentum and the price was pushed to the demand zone of $0.075.
Cardano price continued its bullish movement in its long-term outlook towards the supply zone of $0.080. Currently, there is a rejection of the pair at the supply zone of $0.080 and the pair is returning to its previous low. In case the price falls to its previous low of $0.071 and it bounces, traders should look out for buy stops to initiate long trades.
The price is below 4-day EMA and the 50-day EMA which indicates that the price is falling. RSI is below the 50-level pointing towards the south indicates that there are possibilities for further downward movement.
ADA/USD Medium-term Trend: Bearish
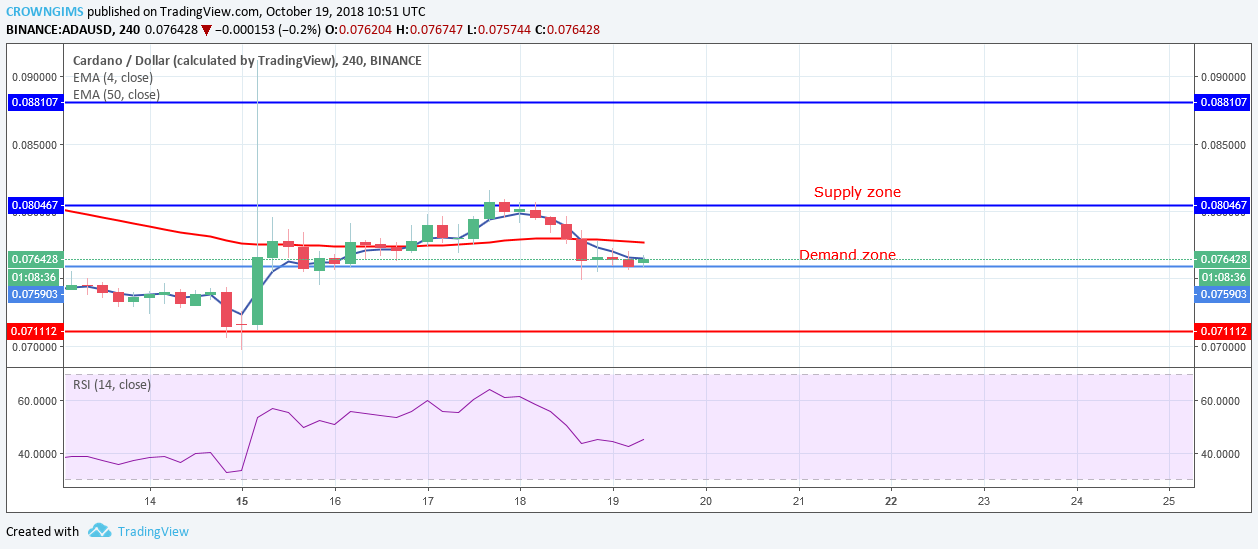
10-day EMA has crossed the 50-day EMA downside and the price is below 10-day EMA and 50-day EMA which indicates downtrend is ongoing.
In case the demand zone of $0.075 holds, the Cardano price will bounce to the north and break the strong supply zone of $0.080, ADA will resume its uptrend movement towards the supply zone of $0.088.
next