
Chainlink (LINK) surged 9% as bullish momentum intensified, with data hinting at a potential breakout.
On Thursday, Chainlink LINK $8.89 24h volatility: 3.4% Market cap: $6.29 B Vol. 24h: $343.62 M recorded a sharp 9% jump, pushing its price to around $14.88. The token’s 24-hour trading volume soared by 30% to reach $353 million, indicating renewed investor interest.
Meanwhile, data from Santiment showed that over 3.32 million LINK tokens, worth around $49.4 million, were withdrawn from centralized exchanges in the past day. Such outflows are often signs of self-custody, suggesting that investors are preparing to hold long-term.
Over 3.32 million #Chainlink $LINK have flowed out of exchanges in the past 24 hours, as shown by on-chain data from @santimentfeed! pic.twitter.com/s7vgJUAMGp
— Ali (@ali_charts) May 8, 2025
Chainlink has recently seen greater adoption amid growing demand for Real World Asset (RWA) tokenization. Institutions are increasingly looking at blockchain to bring traditional assets on-chain.
Link price outlook
Popular crypto analyst Clifton recently pointed out on X that LINK has been trading within a Descending Channel Formation since December 2024. If the cryptocurrency breaks above this pattern, it could see a powerful 100%-150% rally, according to him.
$LINK is forming Descending Channel Formation in daily Timeframe..
In Case of Upside breakout Expecting 100 – 150% massive bullish Rally📈#LINKUSDT #LINK #CryptoScam pic.twitter.com/e5stdQBePg
— Clifton Fx (@clifton_ideas) May 8, 2025
On the daily LINK chart, the price is currently testing the upper band of the Bollinger Bands. The sharp move to the upside suggests bullish momentum, and a sustainable hold above $15.60 could push the token toward the $18-$20 range.

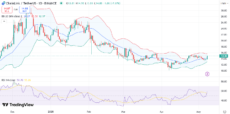
LINK daily chart with RSI and Bollinger band | Source: TradingView
Meanwhile, the RSI stands at 58, just shy of the overbought threshold. This hints at growing bullish momentum without being overheated. If RSI climbs further upwards, it could mark a near-term top at $17.
The MACD line is below the signal line with histogram in red territory. This suggests that selling pressure is still high among investors. If the token fails to hold the $13.80 level, traders could see a short-term correction.
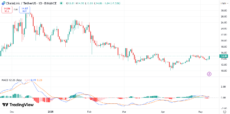
LINK daily chart with MACD | Source: TradingView
It is interesting to note that LINK seems to be forming a bullish flag pattern on the 4-hour chart. The flagpole started with a significant upward move around April 19 to April 23 with the flag developed till May 7.

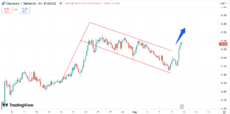
LINK 4-hour chart with bullish flag pattern | Source: TradingView
If the price breaks out above the upper trendline of the flag around $14.90, the potential price target could be around $17.50.
LINK’s recent price surge mirrors the broader market rally, as the global crypto market cap expanded by 3.5% in the past day.
next