LINK saw a 9% price spike and a 30% rise in trading volume on May 8.
Over 3.32 million LINK tokens exited exchanges, signaling strong holder conviction.
Analyst sees a 100%-150% rally likely if LINK breaks its months-long descending channel.
On Thursday, Chainlink LINK$7.9924h volatility:2.3%Market cap:$5.81 BVol. 24h:$170.23 M
recorded a sharp 9% jump, pushing its price to around $14.88. The token’s 24-hour trading volume soared by 30% to reach $353 million, indicating renewed investor interest.
Meanwhile, data from Santiment showed that over 3.32 million LINK tokens, worth around $49.4 million, were withdrawn from centralized exchanges in the past day. Such outflows are often signs of self-custody, suggesting that investors are preparing to hold long-term.
Chainlink has recently seen greater adoption amid growing demand for Real World Asset (RWA) tokenization. Institutions are increasingly looking at blockchain to bring traditional assets on-chain.
Link price outlook
Popular crypto analyst Clifton recently pointed out on X that LINK has been trading within a Descending Channel Formation since December 2024. If the cryptocurrency breaks above this pattern, it could see a powerful 100%-150% rally, according to him.
$LINK is forming Descending Channel Formation in daily Timeframe..
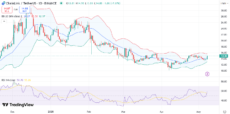
On the daily LINK chart, the price is currently testing the upper band of the Bollinger Bands. The sharp move to the upside suggests bullish momentum, and a sustainable hold above $15.60 could push the token toward the $18-$20 range.
LINK daily chart with RSI and Bollinger band | Source: TradingView
Meanwhile, the RSI stands at 58, just shy of the overbought threshold. This hints at growing bullish momentum without being overheated. If RSI climbs further upwards, it could mark a near-term top at $17.
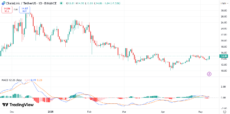
The MACD line is below the signal line with histogram in red territory. This suggests that selling pressure is still high among investors. If the token fails to hold the $13.80 level, traders could see a short-term correction.
LINK daily chart with MACD | Source: TradingView
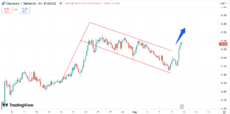
It is interesting to note that LINK seems to be forming a bullish flag pattern on the 4-hour chart. The flagpole started with a significant upward move around April 19 to April 23 with the flag developed till May 7.
LINK 4-hour chart with bullish flag pattern | Source: TradingView
If the price breaks out above the upper trendline of the flag around $14.90, the potential price target could be around $17.50.
LINK’s recent price surge mirrors the broader market rally, as the global crypto market cap expanded by 3.5% in the past day.
Disclaimer: Coinspeaker is committed to providing unbiased and transparent reporting. This article aims to deliver accurate and timely information but should not be taken as financial or investment advice. Since market conditions can change rapidly, we encourage you to verify information on your own and consult with a professional before making any decisions based on this content.
A crypto journalist with over 5 years of experience in the industry, Parth has worked with major media outlets in the crypto and finance world, gathering experience and expertise in the space after surviving bear and bull markets over the years. Parth is also an author of 4 self-published books.