
Bitcoin registered 1.58% gains while the S&P 500 dropped 1.48% on September 2, breaking their historical correlation pattern. Market signals point to a potential altseason beginning.
Historically, the cryptocurrency market, led by Bitcoin BTC $60 496 24h volatility: 0.9% Market cap: $1.21 T Vol. 24h: $22.11 B , has registered a significant correlation to the US stock market, most of the time moving upward when stocks go up and downward when stocks go down. This correlation is now being challenged on September 2, with the United States back from Labor Day holidays.
In particular, the S&P 500 started the day with a 1.48% drop at 6,364 points, while BTC was registering 1.58% gains at $110,987 per coin, according to data from Google Finance.

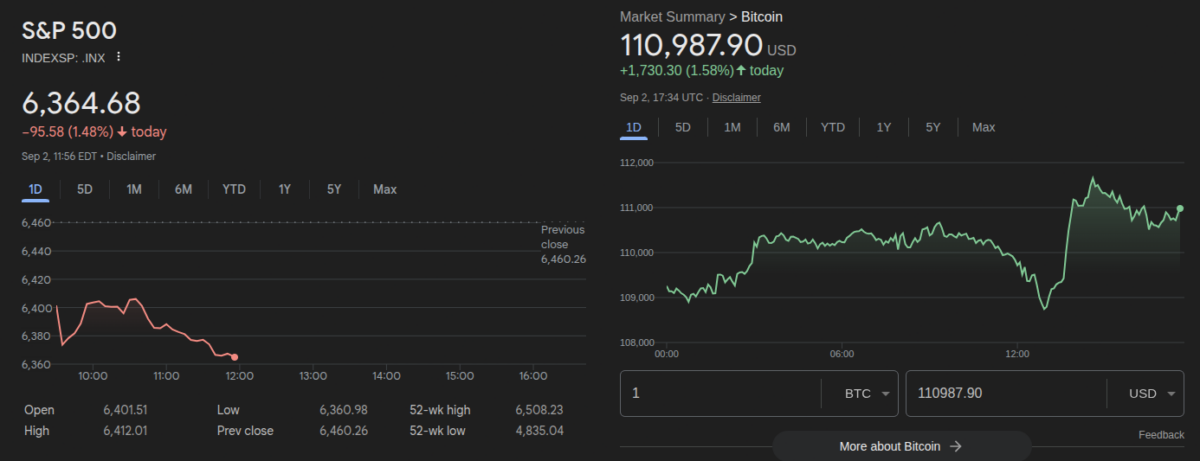
S&P 500 chart (left) and Bitcoin price chart (right) on September 2 | Source: Google Finance
Moreover, not only is Bitcoin decoupling from the US stock market. Altcoins are also registering significant gains, as TradingView’s crypto total market cap index hovers above $3.77 trillion, up 1.5% intraday.
Earlier today, Coinspeaker covered Michael van de Poppe blaming gold’s rally for the delayed altseason, mentioning a risk-on and risk-off positioning battle for institutional and retail investors. Nevertheless, the market is giving signals of a starting altseason while gold continues to register new highs.
Among these signals, there is the Bitcoin Dominance Index (BTC.D), which has broken down from a multi-year uptrend, with BTC capital slowly rotating to altcoins. A trend is also seen among institutional investors regarding ETH ETF inflows and old Bitcoin whales selling BTC to accumulate Ethereum—both previously reported by Coinspeaker.
Additionally, the Altseason Index on Coinglass “has climbed to 61,” the crypto analyst who goes by Lucky highlighted on X. According to him, this stage sets the way for the next altcoin season.
The Altseason Index has climbed to 61, this is the highest level in 8 months, altcoin strength is growing against Bitcoin really strong.
With silent whale accumulation underway, the stage could be set for the next altcoin season. pic.twitter.com/xwp3y18wYv
— Lucky (@LLuciano_BTC) September 2, 2025
Bitcoin Diverges from S&P 500 Trading Pattern
Bitcoin price has a historical correlation to the S&P 500, with both making similar movements up and down, as observed in the cross-asset chart from TradingView. Nevertheless, there are moments in the chart where we can see BTC decoupling from the US stock market leading indicator to, first, print huge gains and, later, experience large crashes back to the correlation trail.
Two notable moments of such activity were in 2017—marking the second-largest bull market in crypto history, followed by the first relevant altseason with BTC.D dropping from over 90% to sub-40%—and 2021, marking the largest crypto bull market, featuring the second big altseason with Bitcoin market cap dominance dropping from 70% to, again, sub-40%.

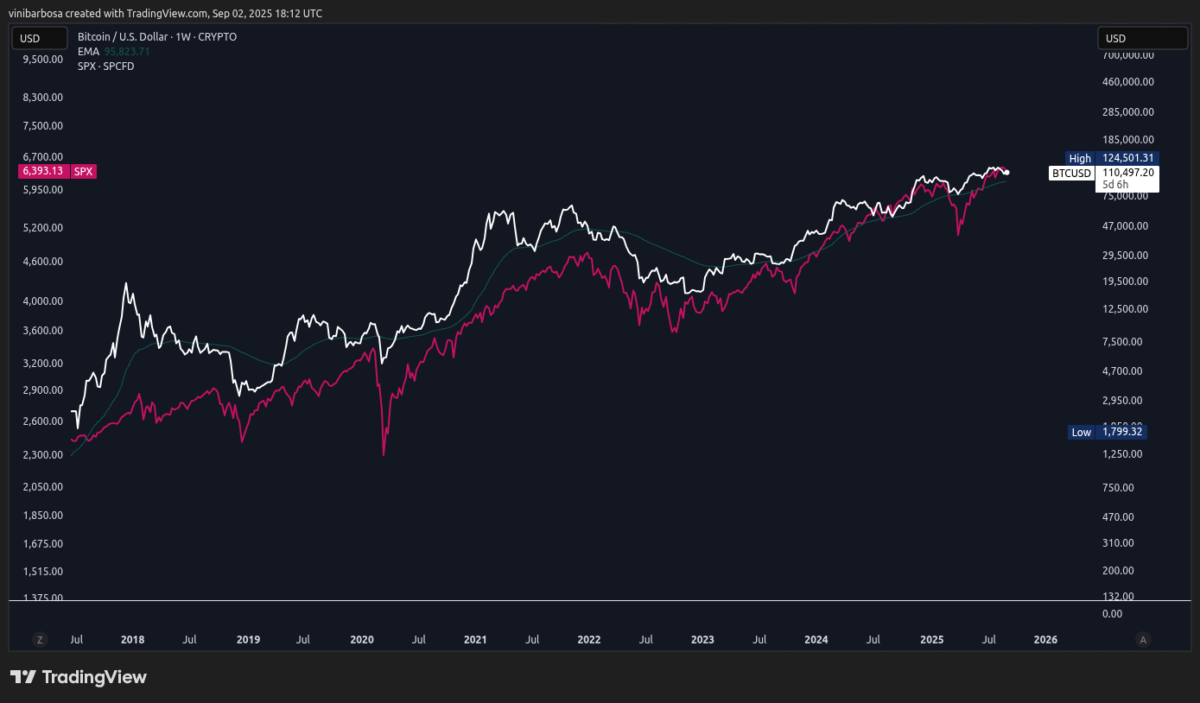
BTC/USD and SPX 1W correlation chart | Source: TradingView
As of this writing, BTC.D goes at around 58%, after peaking at 65% this cycle, and Bitcoin teases a decoupling from the stock market. In an intersection between the two worlds, Michael Saylor’s company Strategy (NASDAQ:MSTR) announced another massive Bitcoin purchase, scooping over 4,000 BTC for $449 million, close to what could be a local bottom.
next