Dogecoin just saw its biggest rebound in weeks while its new ETFs quietly pulled in almost $2M in inflows.
Dogecoin (DOGE) just came out of a rough month after dropping by 22% before a sharp bounce pushed it almost 9% higher this past week, with the price now near $0.1493. Meanwhile, the new DOGE ETFs, Grayscale’s GDOG and Bitwise’s GWOW, also saw significant inflows.
GDOG now sits near $3.8 million in net assets, and GWOW holds $2.48 million. Together, they now reflect about $2 million in net inflows. However, as per SoSoValue, DOGE ETFs showed zero flows on November 28 but recorded $1.8 million on November 25 and $365K on November 26.
On the other hand, Bitcoin ETFs took in more than $71 million on November 28, while Ether and Solana ETFs also saw healthy flows. It is clear that DOGE is still waiting for a sustained wave of ETF demand.
The Two Key Levels for DOGE Price
Prominent analyst Ali Martinez pointed out two simple levels that remain very important for DOGE. Support sits near $0.08, a zone that shows a heavy cost basis cluster on the heatmap.
Key levels for Dogecoin $DOGE:
– Support at $0.08
– Resistance at $0.20 pic.twitter.com/WSVbYdgFHs— Ali (@ali_charts) November 29, 2025
On the other hand, the resistance sits near $0.20, which lines up with a wall of supply held by long‑term holders. The heatmap shows a dense band between these two prices, which means DOGE holds a wide mid‑range block before it escapes the chop.
DOGE Price Analysis: What’s Next?
The weekly chart paints a cleaner view with the price sitting inside a large descending structure with support holding along the same base for months. DOGE touched this floor again, and each time it formed a steady base.
Meanwhile, the Bollinger Bands show compression. RSI hovers near the lower half, which indicates room for a bounce. A break above the long trendline could result in a retest of the $0.20 zone, and a close above that area clears space for higher levels.

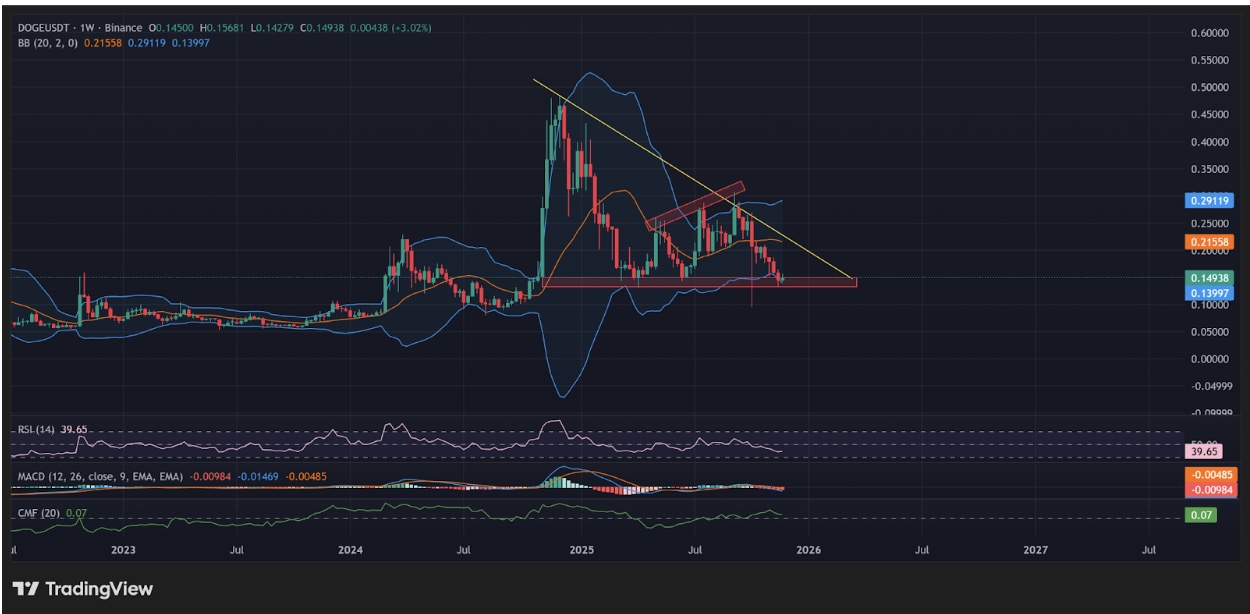
DOGE weekly chart with momentum indicators | Source: TradingView
According to Bitcoinsensus, DOGE follows a repeated cycle, i.e., accumulation leads to a wave up, and a bigger accumulation leads to a bigger wave. If the pattern holds, the weekly structure sets the stage for a rally toward $0.80. The chart supports this view as long as the price stays above the base zone, making DOGE one of the best meme coins to buy in 2025.
$DOGE Weekly BULLISH Setup Forming Here 📈💥#Dogecoin has been moving in a very predictable way all throughout this cycle :
✅Accumulation -> Wave Up
✅Larger Accumulation -> Bigger Wave UpIf this pattern continues, we could possible hit new all time highs at 0.80$ per… pic.twitter.com/QBxC9Qow4e
— Bitcoinsensus (@Bitcoinsensus) November 28, 2025
However, if DOGE drops under the $0.08 floor, the structure breaks. That move resets the entire range and forces price into a long reset phase.
next