Dogecoin is testing support at $0.218 within a falling wedge pattern, with a potential drop to $0.12 if this level breaks.
The Dogecoin DOGE $0.0913 24h volatility: 1.9% Market cap: $14.04 B Vol. 24h: $1.31 B price has been moving sideways and is constantly under selling pressure with a 25% drop over the past month, from the highs of $0.28.
This fall comes with the largest DOGE holders selling during recent price drops, signaling skepticism about a near-term recovery. Market analysts predict the possibility of another 45% drop from here onwards.
Will Dogecoin Price Crash to $0.12 From Here?
The Dogecoin chart shows growing downside risk as the meme coin tests support at the rising wedge’s lower trendline near $0.218. If this level fails, DOGE could slide toward the wedge target of $0.12, which would represent a potential 45% drop.

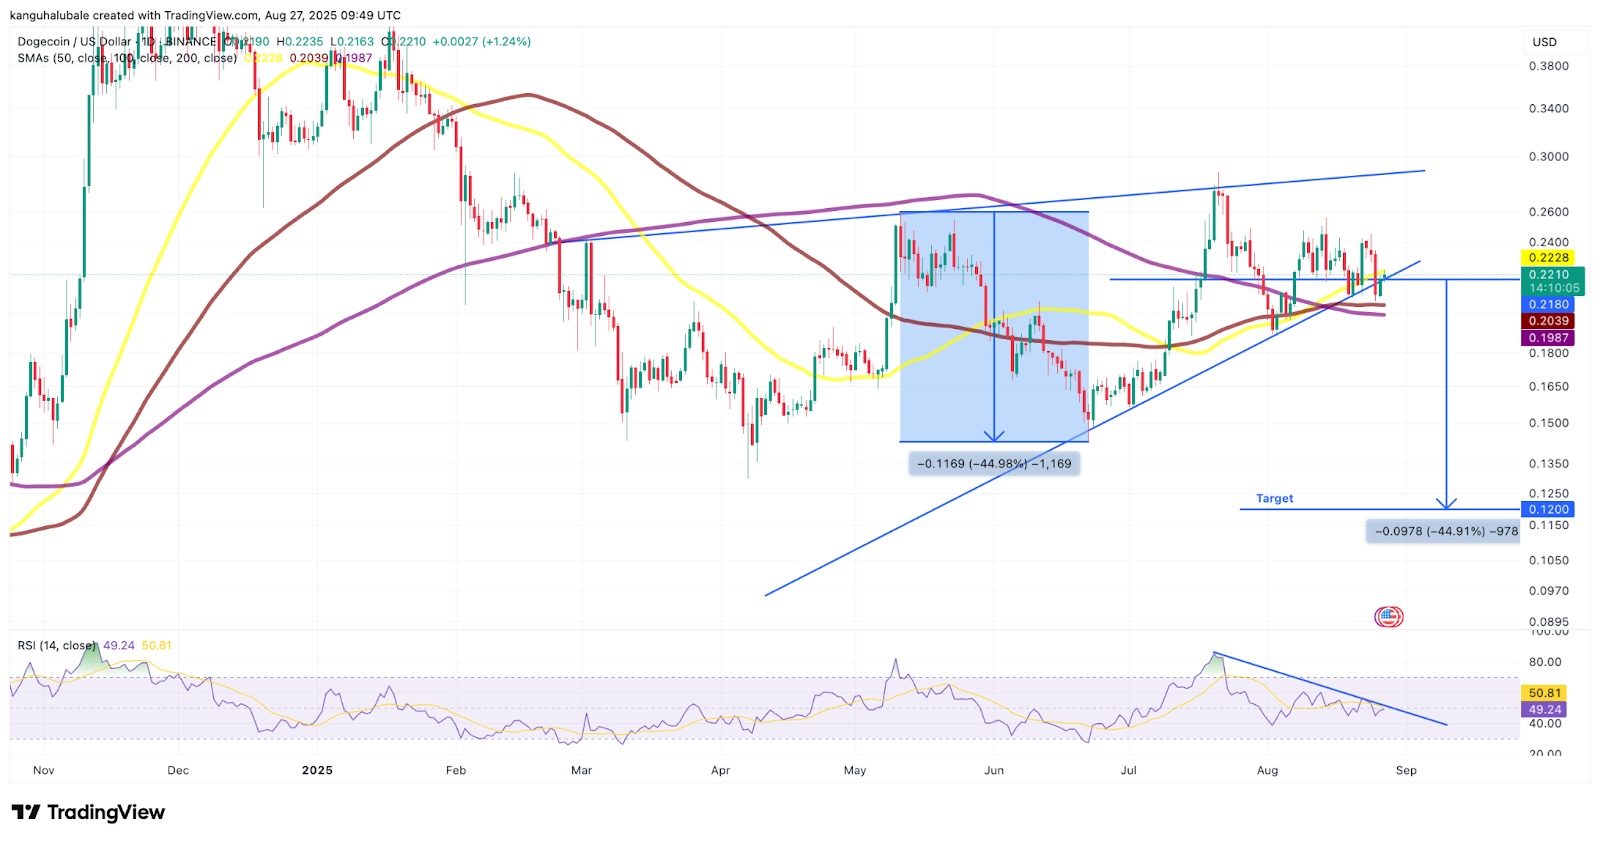
The Dogecoin price tests support at the rising wedge trendline. | Source: TradingView
Technical indicators also point to weakening momentum. The relative strength index (RSI) has dropped to 49 from overbought levels of 85 on July 20.
Analysts note that DOGE must maintain support around the $0.19–$0.20 zone, aligned with its 100-day and 200-day moving averages, to prevent further losses toward $0.16.
On-Chain Metrics Show Weakening Signs
Derivatives data shows weakening sentiment, with DOGE futures open interest dropping to $3.24 billion from $5.25 billion a month ago.
According to data from blockchain analytics firm Santiment, the wallets holding between 10 million and 100 million DOGE have decreased their holdings by 6% since late July.

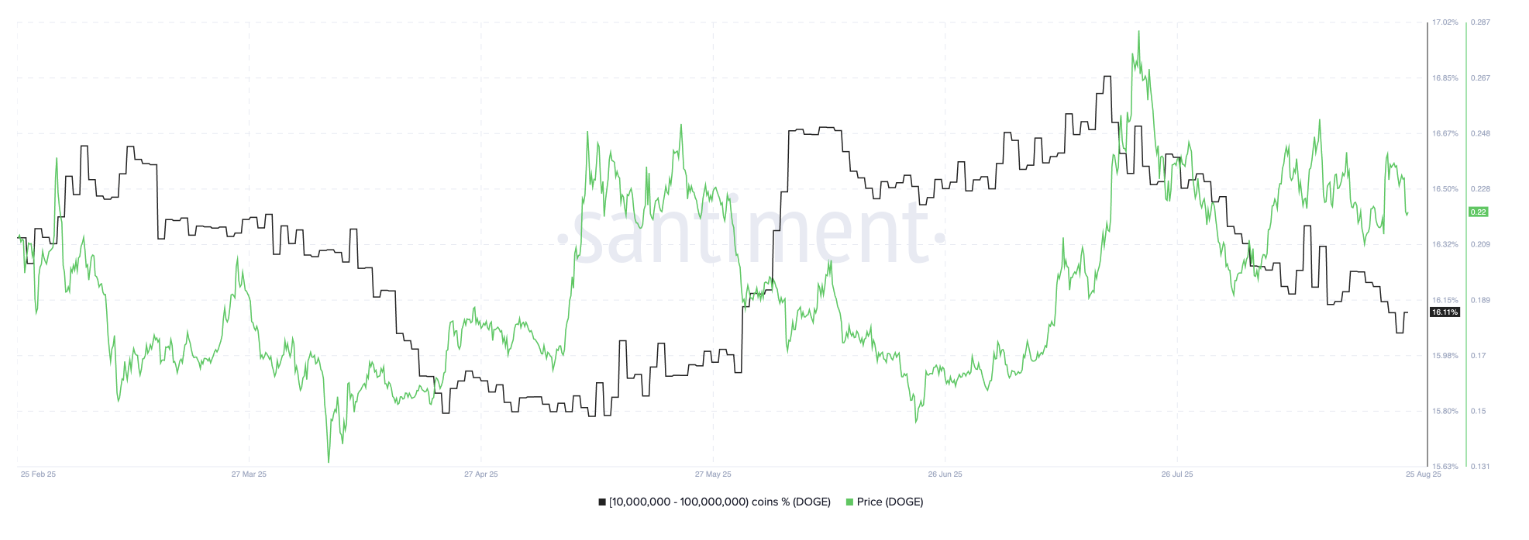
Dogecoin’s supply distribution across wallets. | Source: Santiment
A recent transaction highlighted by Whale Alert revealed that an unknown whale transferred 900 million DOGE, valued at over $200 million, to Binance, raising concerns of potential short-term sell pressure.
🚨 🚨 🚨 🚨 🚨 🚨 🚨 🚨 🚨 900,000,000 #DOGE (207,970,364 USD) transferred from unknown wallet to #Binancehttps://t.co/4hdgtjHwnb
— Whale Alert (@whale_alert) August 15, 2025
Large-scale distributions like this during price declines often indicate that major holders anticipate further downside risks.
Meanwhile, network activity appears subdued, with daily active Dogecoin addresses dropping to 58,000, down sharply from a peak of 1.65 million in Q4 2024 and 674,500 in July, signaling weaker engagement on the blockchain.
The decrease in active addresses shows lower user engagement on the network, which shows the waning retail interest in the meme coin.
Maxi Doge: The Meme Coin Making Waves with $1.6M Raised
Degen meme coin Maxi Doge has exploded in popularity since launch, raising over $1.6 million in its first month. The strong debut shows massive investor interest despite ongoing crypto market volatility.
Branded as Dogecoin’s “frustrated but ripped cousin,” Maxi Doge is gunning for the top, taking aim at giants like Dogecoin, Shiba Inu SHIB $0.000006 24h volatility: 1.5% Market cap: $3.43 B Vol. 24h: $113.57 M , and Bonk BONK $0.000006 24h volatility: 3.0% Market cap: $503.66 M Vol. 24h: $53.66 M .
Key Details:
- Ticker: MAXI
- Network: Ethereum
- Token Price: $0.000254
- Funds Raised: $1.60M
With 190% APY staking rewards, exclusive access to a high-alpha trading community, and future integration with perpetual markets, Maxi Doge is quickly becoming the meme coin everyone’s talking about. Make sure you check out our guide on how to buy Maxi Doge if you want to get in early and join the action.
next