Dogecoin is trading flat around $0.25 despite a wider market rally, but some analysts note its long-term accumulation phase and a potential increase.
Dogecoin DOGE $0.10 24h volatility: 2.3% Market cap: $16.98 B Vol. 24h: $1.28 B has remained relatively flat on Oct. 3, even as the broader crypto market trends upward. This lack of momentum has left retail traders cautious, but analysts argue that the meme coin may be on the verge of a major breakout.
Popular crypto analyst Ali Martinez recently pointed out on X that DOGE has been trading within an ascending parallel channel since 2016. According to his analysis, the coin is currently at the lower boundary of the channel, a zone he identifies as accumulation.
Dogecoin $DOGE is still in the accumulation phase. The breakout is coming. Stay alert! pic.twitter.com/z3eNhNa8Dp
— Ali (@ali_charts) October 3, 2025
Martinez suggests investors stay alert, predicting a historic run for DOGE. Many analysts are now expecting $1 for DOGE in Q4. This is a price target that has captured the attention of the community for years.
Major Institutional and Whale Investment
Notably, despite flat daily performance, Dogecoin has quietly gained 10% since the start of October, adding roughly $3.5 billion to its market capitalization. At the time of writing, the top meme coin is trading at around $0.254, showing neither gains nor losses for the day.
This comes as DOGE recently recorded a major surge in whale activity. Data reveals that large investors added around 450 million tokens in late September as the meme coin was trading near the major support of $0.22.
Moreover, Nasdaq-listed Thumzup Media Corporation recently announced a $2.5 million injection into Dogehash Technologies.
The funding is aimed at expanding Dogehash’s DOGE mining capacity. It will allow the company to deploy more than 500 additional miners, potentially increasing its active fleet to over 4,000 ASIC units.
DOGE Price Breakout Ahead?
On the daily DOGE chart, the Bollinger Bands are tightening with the price hovering around the mid band (20-day SMA), hinting at a possible breakout. A push above the upper band near $0.288 could confirm bullish momentum.
However, if DOGE fails to hold the middle band, the lower band near $0.216 acts as the next buying wall.

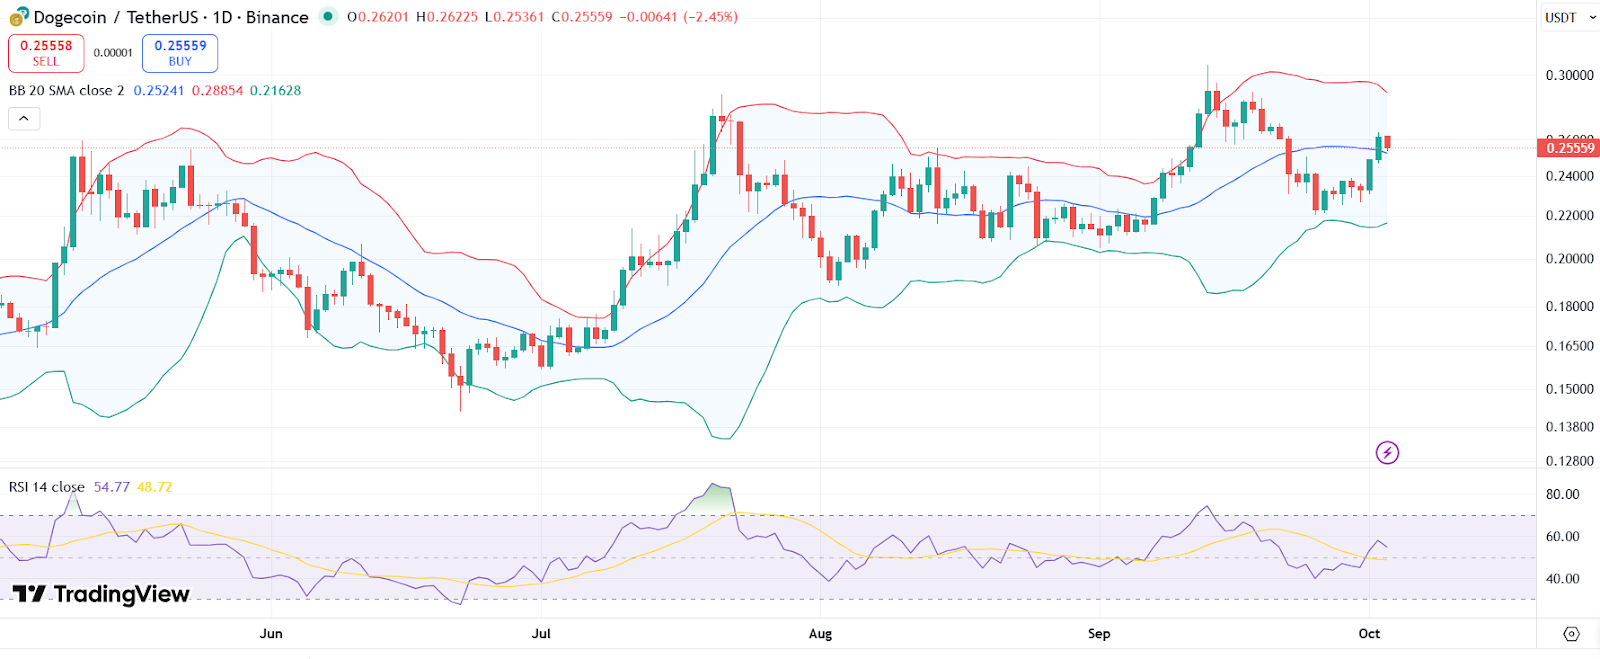
DOGE price chart with RSI and Bollinger Bands | Source: TradingView
The RSI indicates neutral momentum with room for further upside. Traders should watch for key resistance around $0.30 and $0.34 to manage their risks.
next