
In case the Bulls maintain or increase their momentum, Ethereum price will reach its target of $149 supply zone. The loss of bullish momentum will make the coin range towards the previous low of $125 price level.
Key Highlights:
- The Bears took over the control of the Ethereum market;
- the Bearish trend may continue;
- the price is currently exposed to $114 price level.
ETH/USD Medium-term Trend: Bullish
Supply Zones: $134, $149, $161
Demand Zones: $125, $113, $101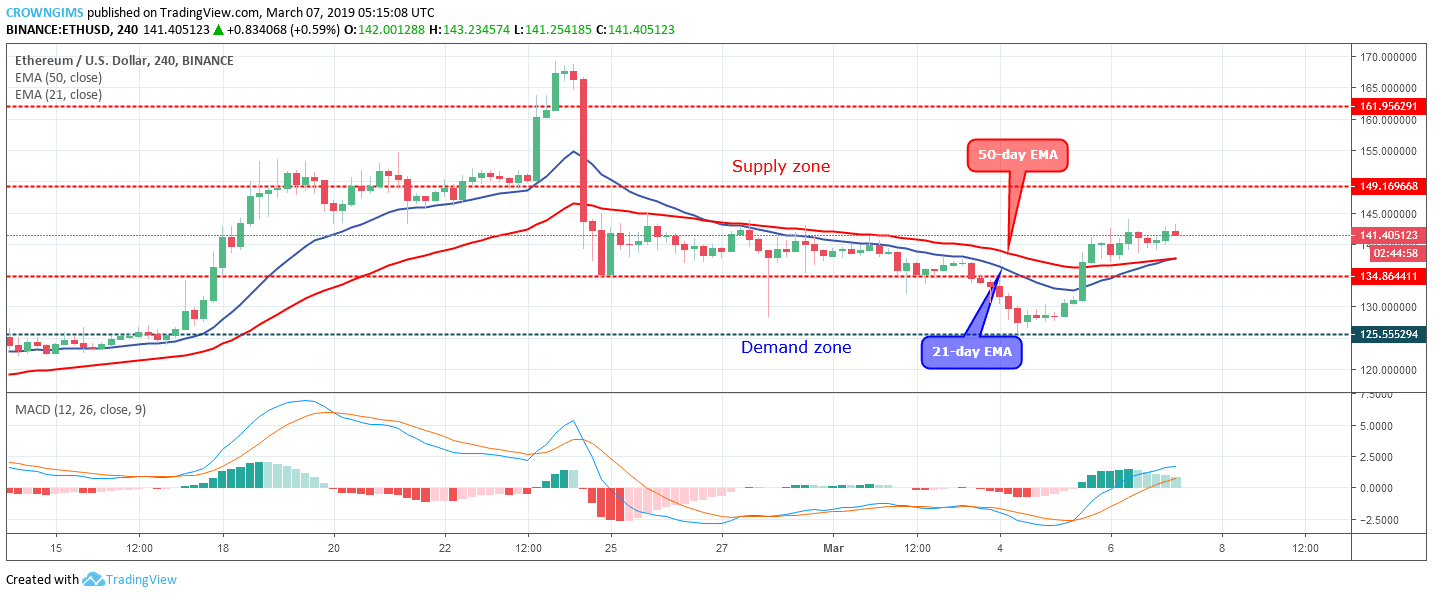

A strong bullish Japanese candle formed that broke up the confluence (combination of dynamic resistance and the barrier of $134 supply zone) at $134 price level. More bullish candles were formed and Ethereum price is currently facing$149 supply zone.
After the penetration of the two EMAs upside, the coin continues trading above the 50 periods EMA and 21 periods while the 21 periods EMA is trying to cross 50 periods EMA upside as a confirmation of the bullish trend.
Meanwhile, MACD period 12 with its Histogram is above the zero levels and the signal lines pointing up which indicates buy signal. In case the Bulls maintain or increase their momentum, Ethereum price will reach its target of $149 supply zone. The loss of bullish momentum will make the coin range towards the previous low of $125 price level.
ETH/USD Short-term Trend: Bullish
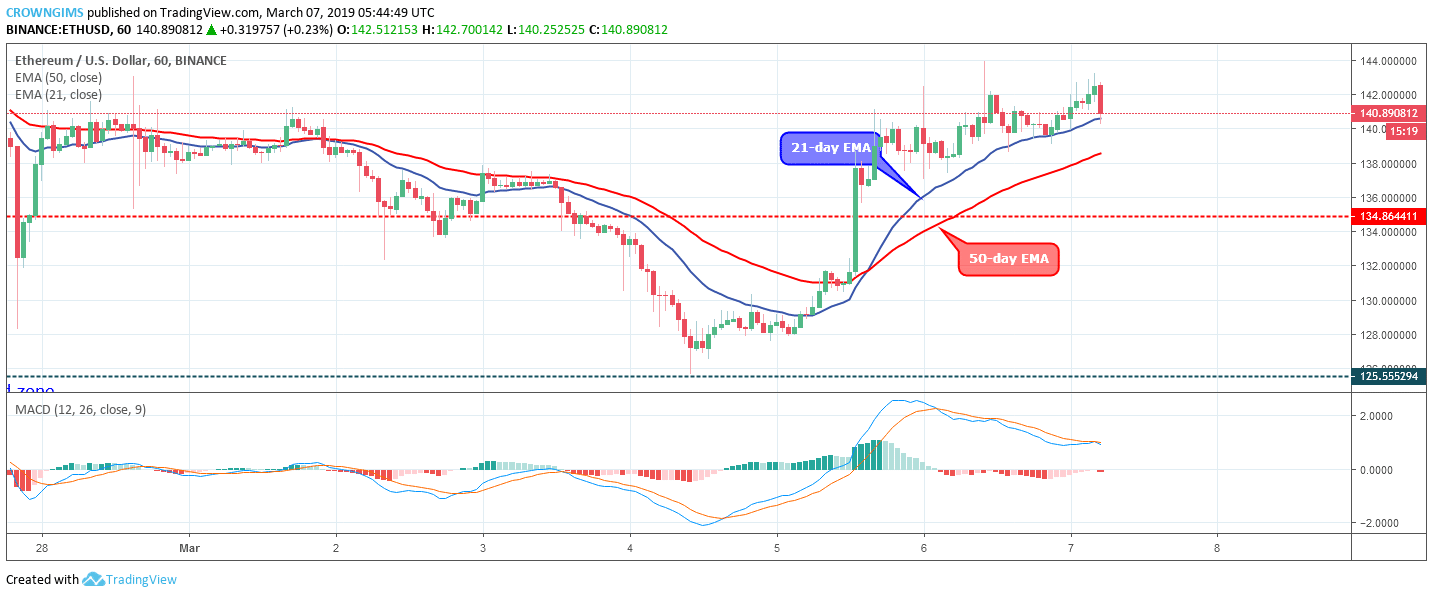
Ethereum price is trading above the 21 periods EMA and 50 periods EMA as an indication of a bullish trend. However, the coin is getting closer to the EMAs as a sign of weak bullish momentum. The MACD with its histogram is below zero levels and the signal lines pointing down connotes that bears are trying to take over.
next