
Hyperliquid records historic trading volumes, market share, and fee generation as its token, HYPE, trades just below its ATH.
Decentralized derivatives trading platform, Hyperliquid HYPE $31.99 24h volatility: 5.6% Market cap: $7.63 B Vol. 24h: $263.43 M , has just recorded a historic 24-hour trading volume of $29 billion, generating $7.7 million in daily fees.
This aligns with the surge in platform’s total value locked (TVL), nearly doubling in four months to $610 million.
The platform’s explosive growth is further evident by $97.7 million in fees generated over the past 30 days. This figure represents around 35% of all blockchain fee revenue in the cryptocurrency ecosystem.
Are DEXs finally taking over?
With Hyperliquid market share vs CEXs reaching an ATH this month, it has cemented itself as the strongest competitor to its centralised counterparts.
What were the key factors in its success, and what are its plans going forward? 🧵 pic.twitter.com/0kZJQo0WTN
— DWF Ventures (@DWFVentures) August 15, 2025
The surge in activity comes as the platform’s native token, HYPE, trades at $47.21, just 5% below its record high of $49.86 set last month. Over the past week, HYPE has surged by 13%, adding around $2 billion to its market capitalization.
In the last 12 months, Hyperliquid facilitated $1.57 trillion in trading volume and reported over $300 million revenue in 2025 second quarter.
Hyperliquid’s Dominance Over CEXs
Launched in 2023 as an Arbitrum-based ARB $0.12 24h volatility: 7.3% Market cap: $691.56 M Vol. 24h: $67.41 M perpetual DEX, Hyperliquid migrated to its own high-performance Layer-1 to rival centralized exchanges (CEXs).
Last month, the platform posted all-time highs in monthly perpetual volume ($320 billion) and revenue ($86.6 million), getting the single largest blockchain revenue share at 35%.
Its aggregate market share versus CEXs rose to 6.1% in August, with record-high levels against Bybit and OKX.
Looking ahead, Hyperliquid aims to expand into spot trading and permissionless liquidity provision. It has also dedicated 388.88 million HYPE tokens to community rewards, fostering developer engagement and user retention.
HYPE Price Outlook
On the daily HYPE price chart, the RSI is indicating positive momentum without being overbought. This suggests room for further upside with the nearest resistance around $50.

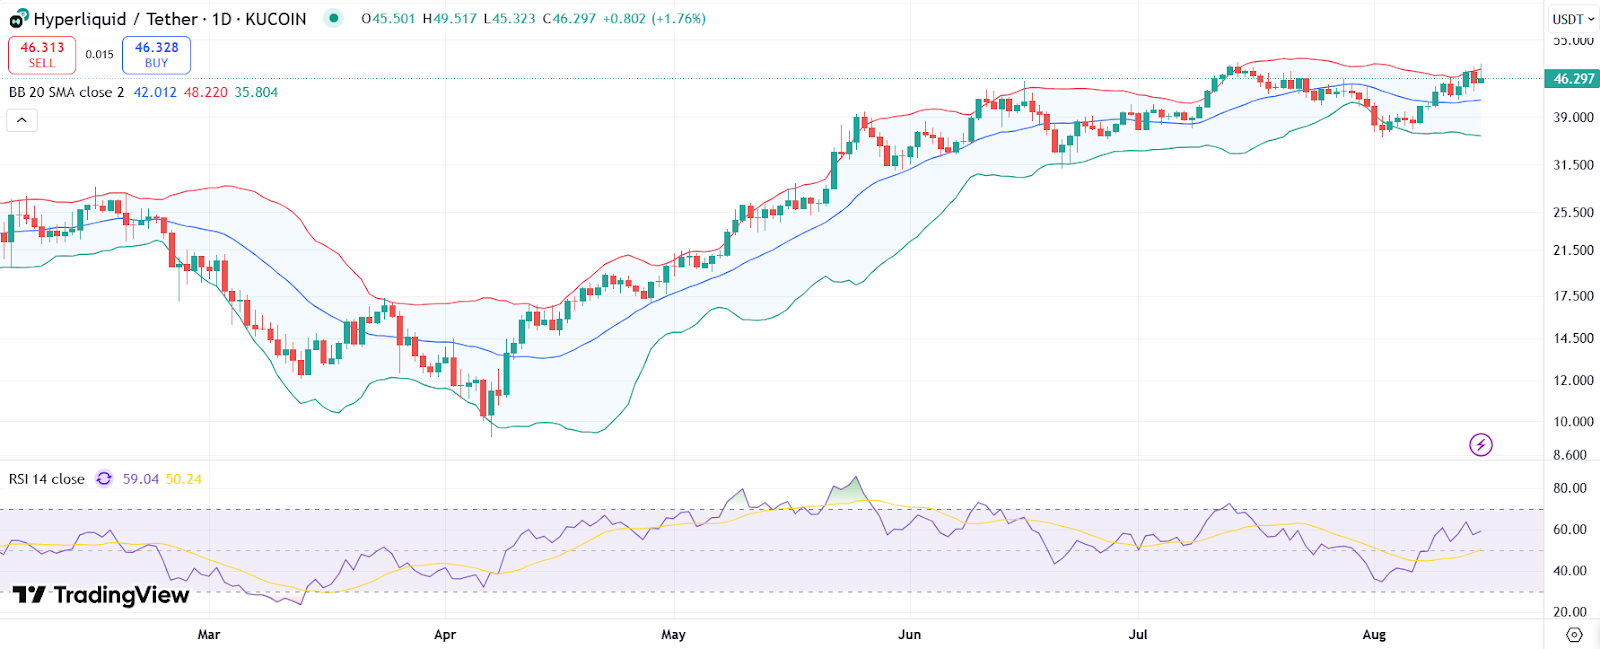
HYPE price chart with RSI and Bollinger Bands. | Source: Trading View
The price is testing the upper Bollinger Band near $49.50, indicating strong buying pressure. However, it also hints at potential short-term resistance, with the middle band (20-day SMA) around $42 serving as immediate support.
A rejection at current levels could see HYPE price retesting $42, and even $36 if selling accelerates.
Meanwhile, the MACD recently crossed bullish, with the MACD line above the signal line. Histograms bars are also rising, further confirming upward momentum.

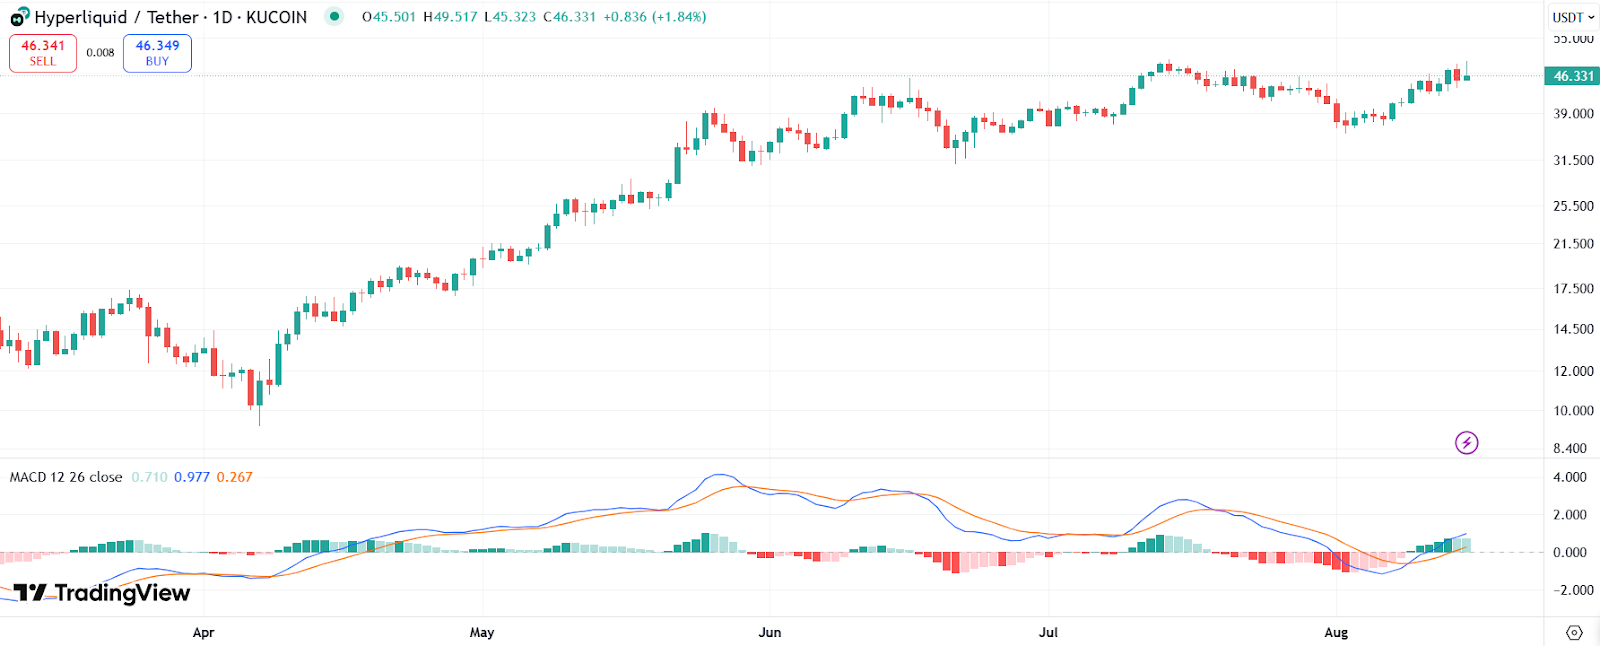
HYPE price chart with the MACD. | Source: Trading View
Hyperliquid has also seen a rise in institutional adoption due to its high-speed Layer-1 infrastructure for large-scale derivatives trading.
Last month, Nasdaq-listed Sonnet BioTherapeutics, Inc. announced an $888 million merger with Rorschach I LLC to launch a HYPE treasury.
Analysts are predicting that HYPE could surge to a new peak soon and become the best crypto to buy this month.
next