
Pi Coin price has formed a bullish crossover on the 1-hour chart as the 20-period EMA crossed above the 50-period EMA.
Pi Network’s native cryptocurrency Pi PI $0.17 24h volatility: 2.1% Market cap: $1.53 B Vol. 24h: $14.88 M price has slipped another 8% over the past week and is finding a floor at $0.35.
Technical chart pattern suggests that the bottom formation could be finally here, with the Pi token eyeing some upside from here onwards.
Pi Coin Price Shows Bullish Crossover
On the 1-hour chart, Pi token experienced a bullish crossover as the 20-period EMA rose above the 50-period EMA. This pushed the Pi price to $0.37 while helping it maintain support during the last session.

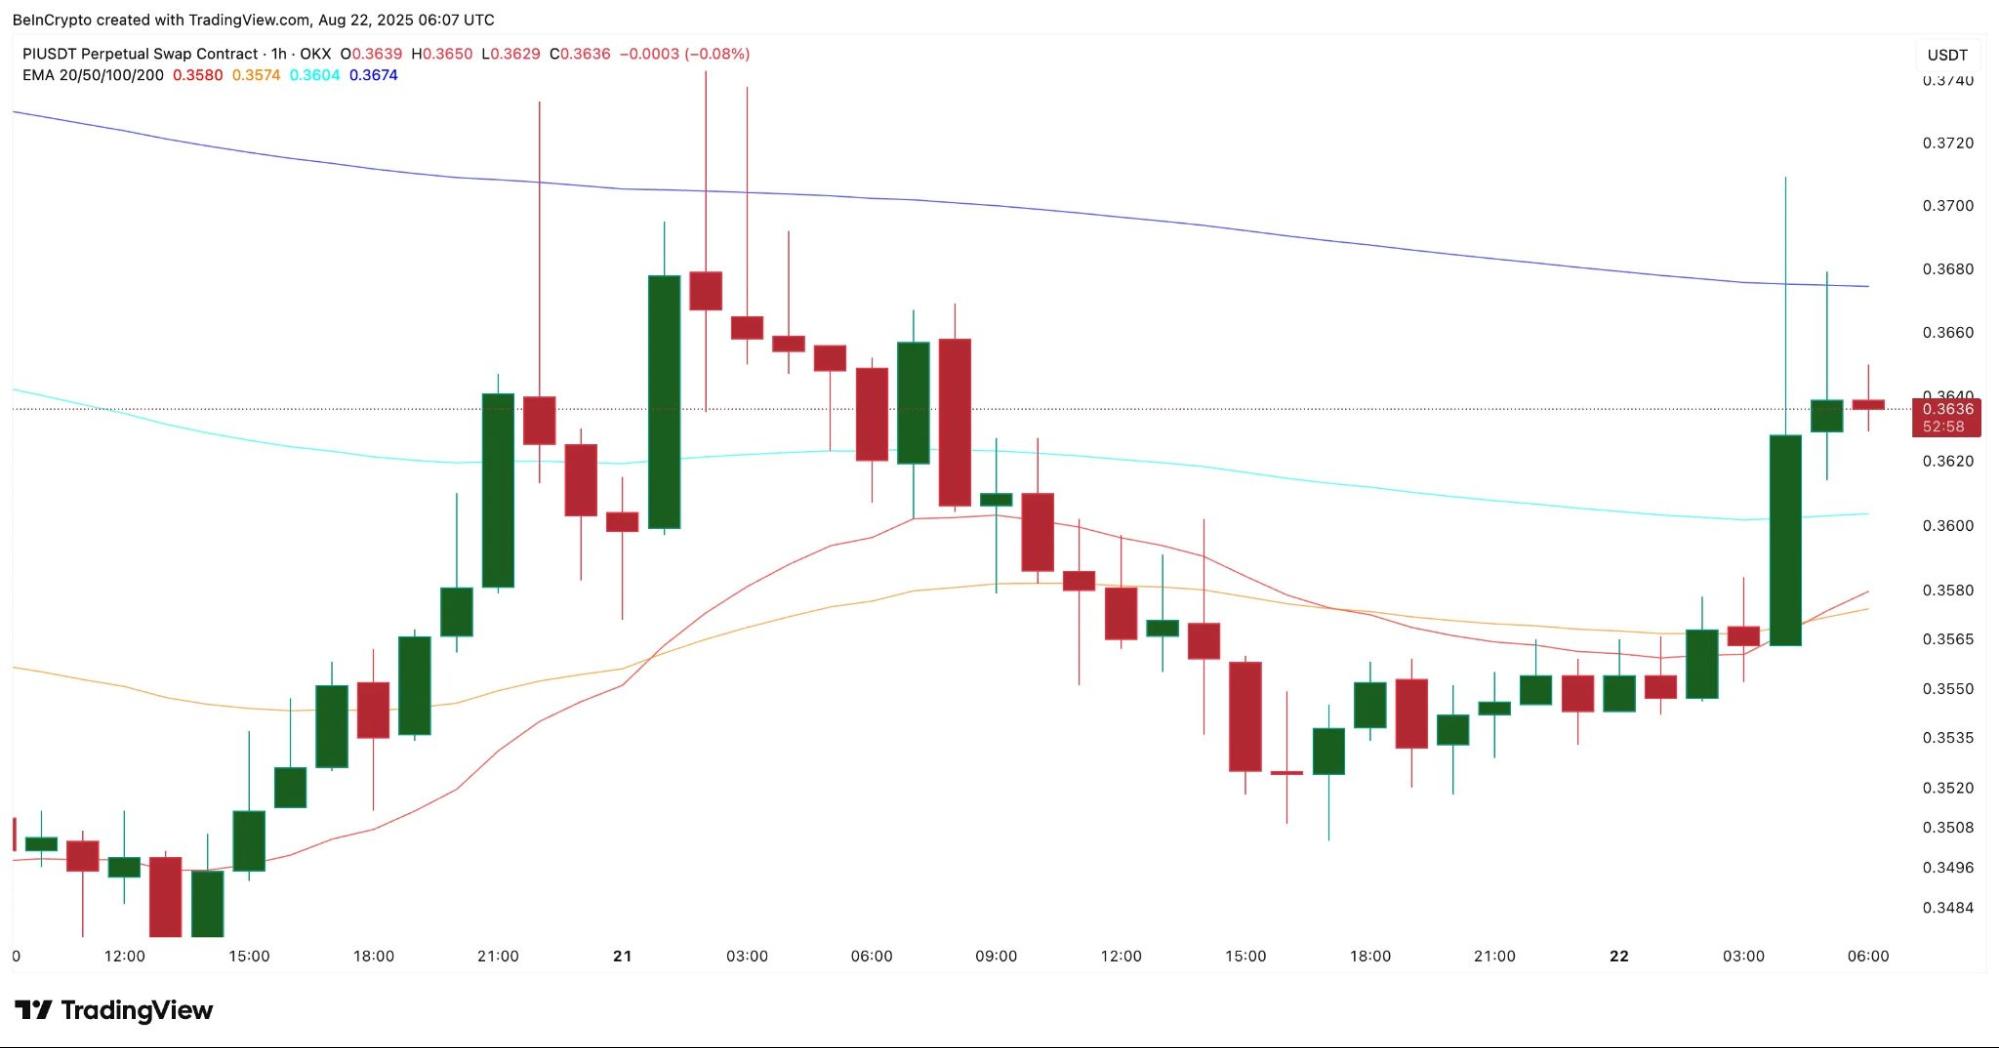
Pi coin price has formed a bullish crossover. | Source: TradingView
A bullish crossover is often seen as an early sign of buying strength. This pattern has appeared before. On August 20, a similar crossover lifted PI from $0.35 to $0.37, though the rally was short-lived.
This shows that short-term EMA crossovers often spark quick price moves, especially when the market has been correcting for a while.
However, the Pi coin price is also suggesting a bullish divergence on the longer timeframe, after a major bearish move.
The 12-hour Pi token price chart indicates a developing trend. On August 20, PI reached $0.3739, followed by a lower high of $0.3712 on August 22, signaling a series of declining price peaks.

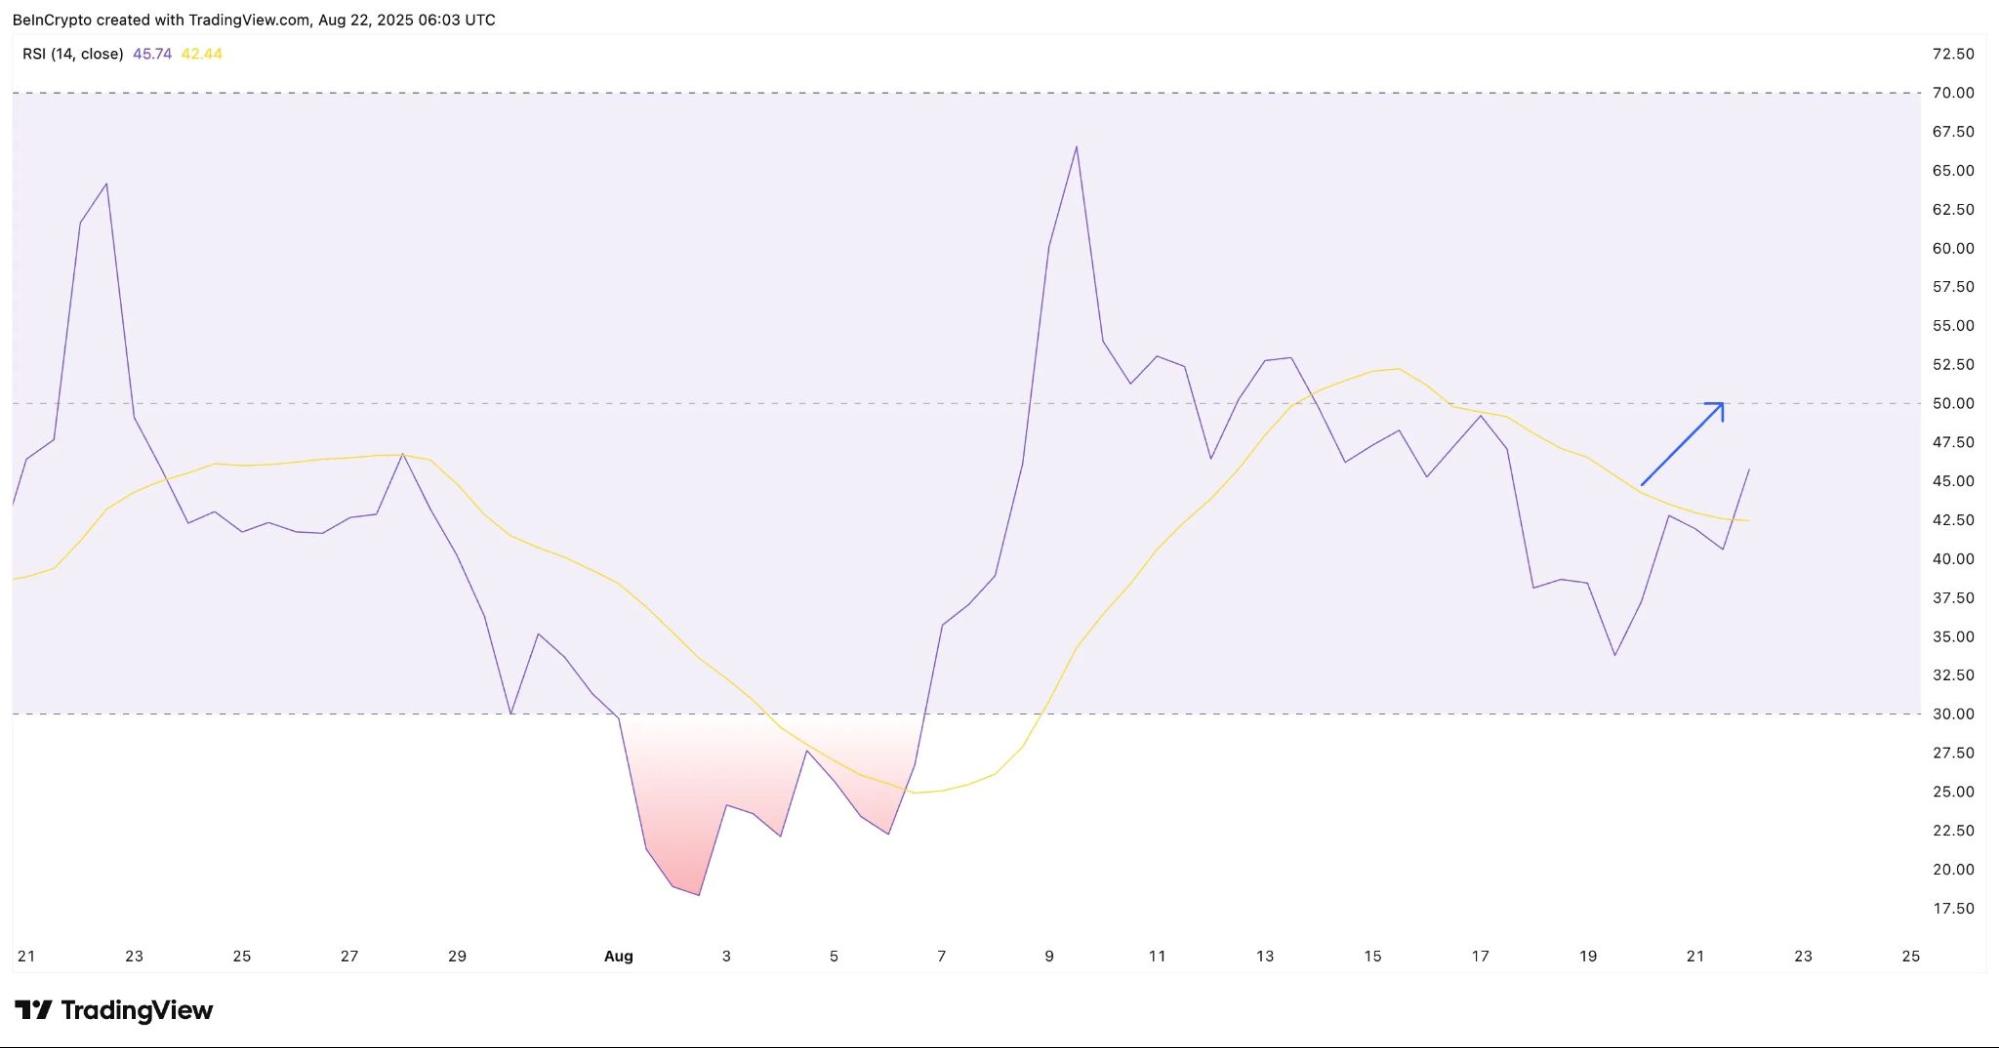
Pi coin price shows bullish divergence on a higher timeframe. | Source: TradingView
Meanwhile, the RSI formed higher highs over the same period, creating a bullish divergence. This indicates that while sellers pushed prices down, buyers were steadily stepping in.
This is notable for Pi, which has largely been in a downtrend this year. The divergence on a longer timeframe indicates that buyers may be gaining control, giving more significance to the 1-hour EMA bullish crossover observed earlier.
Key Levels to Watch Ahead
For the bullish setup to hold, Pi must clear $0.37 and $0.38 on the 12-hour chart, with stronger momentum confirmed above $0.40. A breakout past $0.40 would signal strength beyond short-term EMA moves.
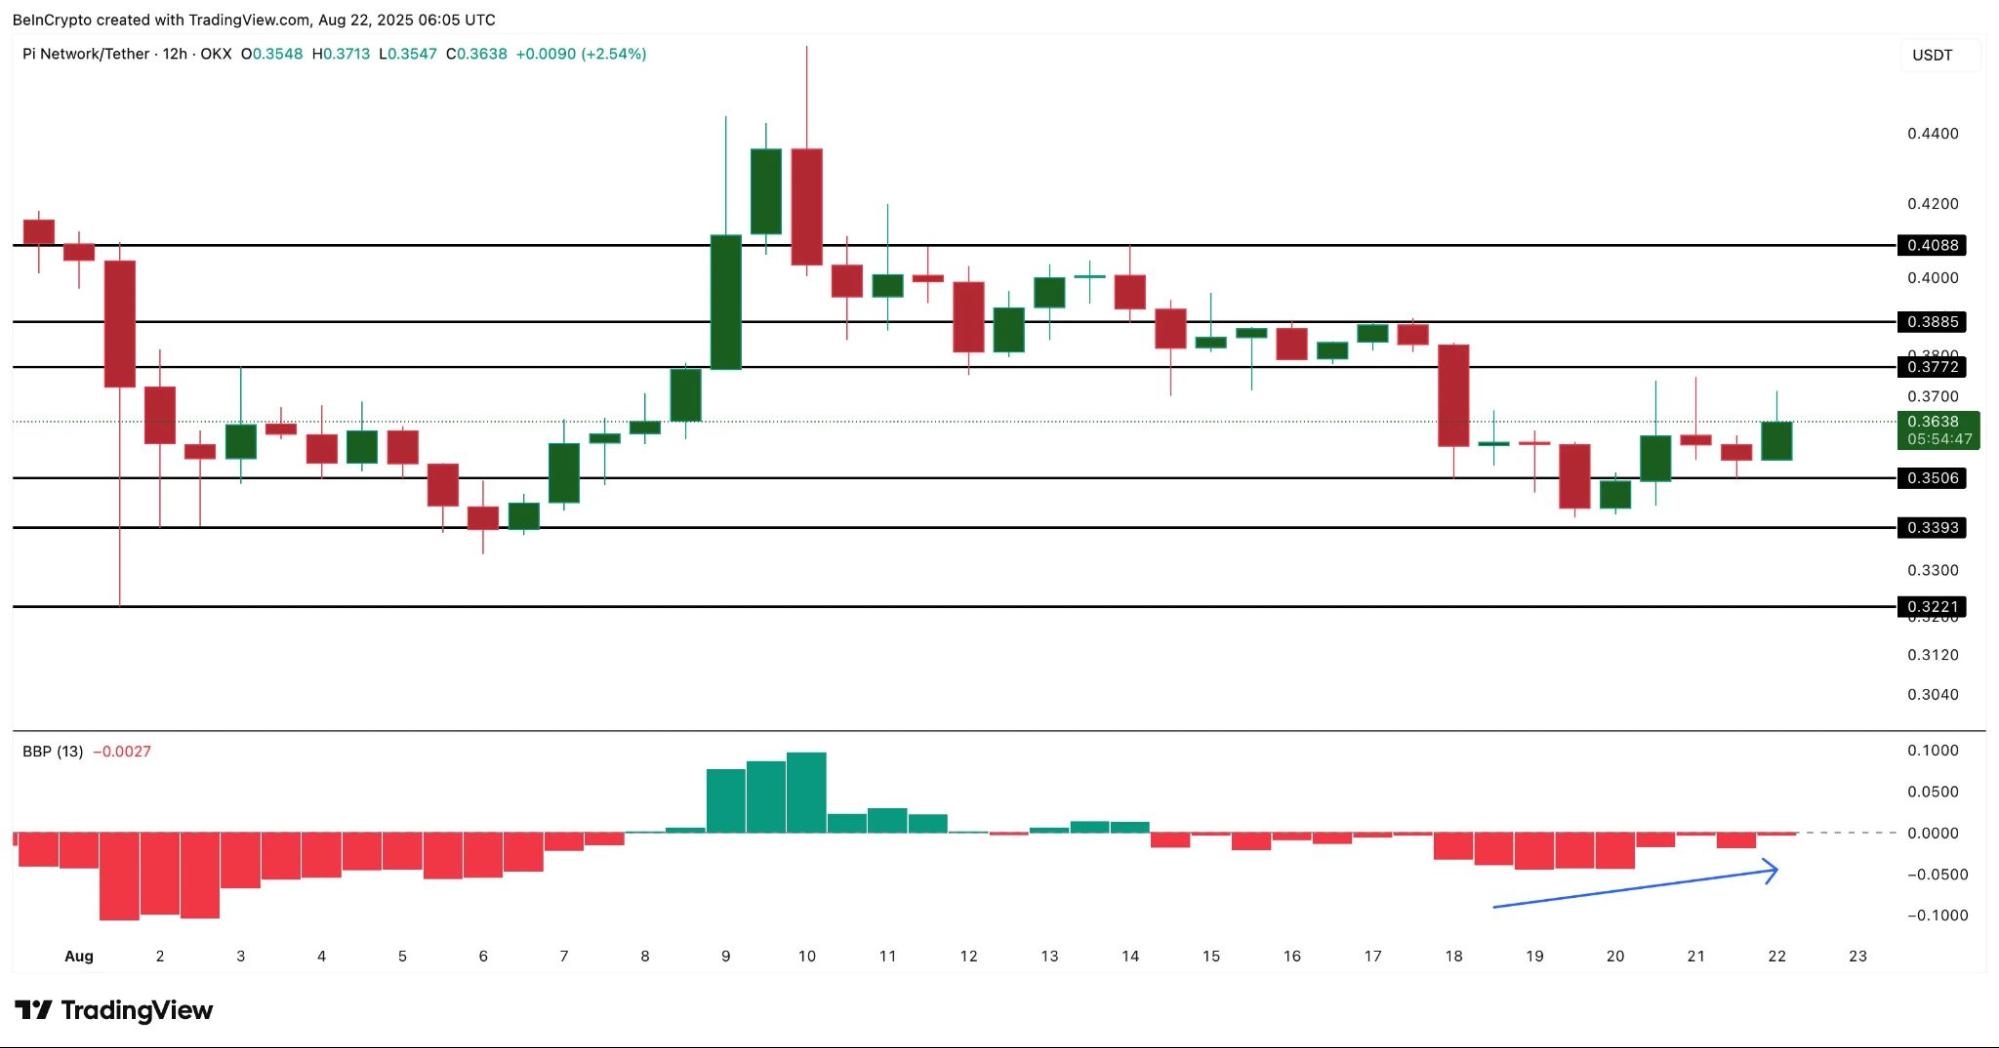
Pi shows bullish momentum above $0.37. | Source: TradingView
The broader bull-bear dynamics support this bullish outlook. Bearish momentum has eased since August 20, with sellers unable to sustain downward pressure on August 21 and 22.
Positive sentiment was further reinforced by the launch of the PI/USDC pair on OKX, encouraging buyers to enter the market.
However, the setup weakens if PI drops below $0.33. A fall under this level could trigger new lows, a pattern the token has historically displayed.
next