SPX6900 is defying the meme coin crash with a 50% weekly rally, dethroning BONK and eyeing a breakout past its all-time high.
SPX6900 SPX $0.34 24h volatility: 0.4% Market cap: $319.11 M Vol. 24h: $7.20 M , a meme coin mockingly modeled after the S&P 500 index, has gained over 50% this week and 10% in the last 24 hours, establishing the fact that despite its parody roots, it has become a serious player in the market.
The coin reached a daily high of $1.73, just shy of its all-time high of $1.77. At press time, SPX is trading at $1.69, holding steady while most meme coins face a broader market correction.
$SPX6900 is the most absurdly bullish meme coin you’re sleeping on.
Here’s what makes it legend-tier material 👇
🧵Launched <$0.001 in 2023. Crashed. Forgotten.
Then?
It mooned 10,000,000% into 2025. Yes, eight zeroes.Survived a total X ban, whale dump, and 45% crash in… pic.twitter.com/qIV6LwSBmq
— Naqeeb 💹🧲 (@qeebtrades) June 10, 2025
BONK Who?
SPX’s parabolic rise knocked BONK BONK $0.000007 24h volatility: 3.4% Market cap: $592.13 M Vol. 24h: $117.11 M off the pedestal as the fifth-largest meme coin by market cap. BONK tumbled by 7% in the last 24 hours, falling to $0.00001625, following a failed breakout at $0.00001640. As market interest shifts, SPX is quickly emerging as one of the top meme coins to watch this year.
The drop was compounded by escalating geopolitical tensions between the US and Iran, which triggered a broader meme coin pullback of 3.5% while Bitcoin BTC $74 214 24h volatility: 0.6% Market cap: $1.48 T Vol. 24h: $35.53 B also dropped from $110K to $107K. However, SPX stood tall, clearly decoupled from the chaos.
SPX’s market cap has exploded from $275 million in March to $1.55 billion. On-chain data shows whale holdings grew from 104 million to 105.29 million SPX over the past month, while tokens held on exchanges fell by 2.7% to 90.21 million.
Technical Outlook: Cup and Handle Breakout Near
The daily chart paints a textbook cup-and-handle formation, now nearing its breakout zone. The neckline of the pattern aligns closely with the $1.73–$1.77 resistance band, just below the all-time high.
Fibonacci Levels indicate critical upside targets at 1.618 Fib: $1.78, 2.618 Fib: $2.48, and the ultimate extension target at 4.236 Fib: $3.00+.
On the other hand, the RSI stands at 81.74, indicating extreme overbought conditions, a potential sign of a short-term cooldown. The MACD remains strongly bullish, with the histogram expanding and signal lines diverging, reflecting increasing momentum.

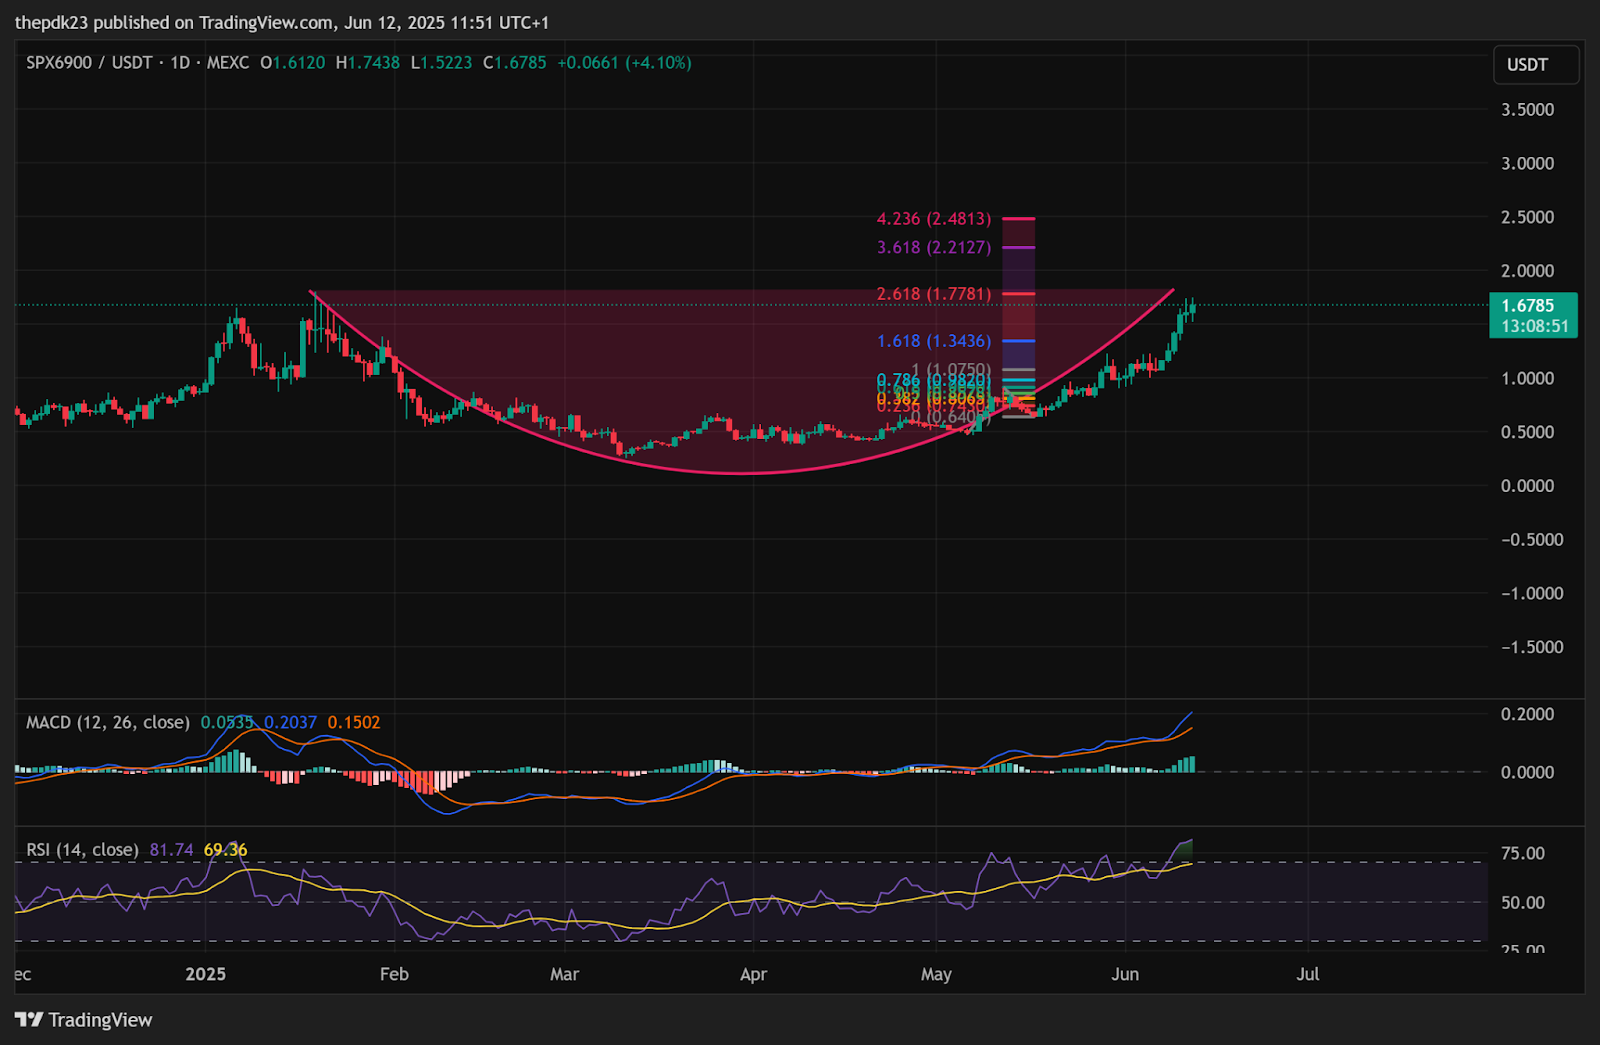
SPX6900 Daily Chart | Source: TradingView
If SPX closes above $1.77, the cup-and-handle breakout target points toward $1.87, a 16% move from current levels. If that zone is breached with volume, bulls could aim for the $2.21–$2.48 range next.
A rejection from the ATH zone could see price retest $1.62, which now acts as support after the Fibonacci 78.6% level was flipped. If sentiment worsens, SPX may slide to $1.34 (Fib 1.618) or even $1.20, near the handle’s lower trendline.
next