SOL has jumped over 8% to $165, but Ethereum’s explosive 21% rally post-Pectra upgrade has weighed on the SOL/ETH ratio.
Solana SOL $82.14 24h volatility: 4.8% Market cap: $46.64 B Vol. 24h: $3.65 B has rallied over 8% in the past 24 hours to trade around $165. This strong upward move comes as the broader crypto market witnesses a 5.3% jump in total market capitalization, sparking renewed interest in altcoins.
SOL, which had been stuck below the $150 mark for over two months, has now seen its value go up by more than 50% over the past month. Its market capitalization has risen to $86 billion, up 62% in the same period.
Meanwhile, Solana’s competitor, Ethereum ETH $1 976 24h volatility: 4.3% Market cap: $238.61 B Vol. 24h: $22.70 B , recently activated its long-awaited Pectra upgrade, leading to a notable uptick in activity and 21% price increase in the past day alone. This has dragged down the SOL/ETH ratio to its lowest point in nearly a month.
According to Coinglass, Ethereum registered $248 million in spot inflows over the last 24 hours, more than triple Solana’s $94 million. BitMEX co-founder Arthur Hayes commented, “It’s fundamental season,” referring to the renewed attention on layer-1 protocols.
It’s fundamental szn bitches. Fuck your no client, no revenue shitcoins. Give me that cash money in the form of buy back and burn. $ETHF = the Amex of #crypto pic.twitter.com/VvjPIFiDpv
— Arthur Hayes (@CryptoHayes) May 9, 2025
Sol price outlook
On the daily chart, SOL is currently testing the upper Bollinger Band at $169.90, indicating short-term overbought status. If SOL manages to break and sustain above this level, it could push towards the next resistance zones at $170 and $180.
However, rejection at this band could send the price to the middle band (20-day SMA) at $162.11, and possibly further down to the lower band at $135.62.

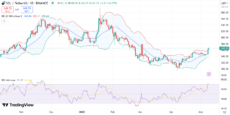
SOL price chart with RSI and Bollinger Bands | Source: Trading View
The RSI currently sits at 71.67, reinforcing bullish momentum. However, it also flags potential for a near-term correction if overbought conditions persist.
Meanwhile, the MACD on the daily chart shows a positive crossover, signaling bullish momentum. Sustained break above $170 with a strong MACD could lead the 6th largest cryptocurrency to $180.

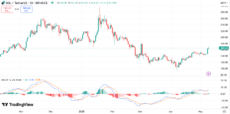
SOL price chart with MACD | Source: Trading View
Popular crypto analyst Ali Martinez recently noted on X that SOL has been forming a bullish cup and handle pattern on the weekly chart since late-2021. According to him, clearing the $200 mark could result in a major bull run for Solana.
#Solana $SOL clearing the $200 mark could spark a massive bull run! pic.twitter.com/VqThvz1xvX
— Ali (@ali_charts) May 8, 2025
Other analysts echoed, saying that SOL could “print some god candles” if the broader crypto market continues its upward trend.
next