
The crypto market is far from its peak, as a key indicator with strong historical accuracy suggests further bullish momentum for Bitcoin.
Bitcoin (BTC) has experienced multiple waves of uncertainty since June 12, when the Israel-Iran conflict began.
The leading cryptocurrency even touched a local low of $99,700 on Monday, June 23. This triggered a market-wide selloff, pushing the global crypto market cap close to the $3 trillion mark.
However, the Pi Cycle Top Indicator suggests the Bitcoin price hasn’t reached its top for this cycle yet. The technical index has effectively pointed out the Bitcoin and crypto market tops in 2011, 2014, 2018, and 2021, according to data from Coinglass.

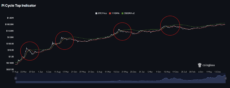
Pi Cycle Top Indicator – June 24 | Source: Coinglass
The Pi Cycle Top Indicator uses the 111-day moving average (red line) and the 350-day x2 (green line) moving average to call for a market peak. As the chart suggests, every time the red line surpassed the green line, Bitcoin recorded a wave of corrections that led to market-wide selloffs.
Despite recording new highs, the Bitcoin price still hasn’t reached its overheated top in this cycle so far, according to the Pi Cycle Top Indicator.
Currently, the 111DMA is sitting at $94,000 while the 350DMA x2 surpassed the $167,000 mark. If history repeats, Bitcoin would at least need to break the $150,000 target before calling for a market top.
Decoupling and Macro Tensions
Bitcoin’s drop to the $100,000 zone sparked speculation of a buying opportunity, while the Israel-Iran war heightened market fear, acting as a significant barrier.
Even Arthur Hayes, the former CEO of BitMEX, called it an opportunity to buy the dip.
An anonymous whale accumulated $113 million in Ethereum (ETH) as the token’s price hovered around $2,200, strengthening the discussions about a price rebound, which consequently happened a day later.
BTC $68 713 24h volatility: 3.6% Market cap: $1.37 T Vol. 24h: $52.35 B gained 3% in 24 hours and is trading at $105,000. ETH $2 064 24h volatility: 4.8% Market cap: $249.19 B Vol. 24h: $17.72 B rose 5% and is currently hovering at $2,380.The fear and greed index rose back from 37 (fear zone) to 47 (neutral zone) over the past day, according to data from CoinMarketCap.
The global cryptocurrency market cap has returned to $3.25 trillion for the first time since June 20.
On the other hand, Bitcoin is showing clear signs of decoupling from the broader crypto market, especially low-cap altcoins.
CMC data shows that the BTC market dominance rose 1.1% to 64.5% while ETH remained at 8.9%. Following Bitcoin’s rise, the altcoin, excluding ETH, market share declined to 26.6%.
In late June 2024, Bitcoin’s market dominance was at 53%. This shows the digital gold has slowly been decoupling from the broader market while trying to cement its position as a store of value.
next