
Solana meme coin BONK gained 60% this week, driven by ETF hype and a potential 1 trillion token burn at 1 million holders. A Golden Cross signals possible further gains.
With 60% gains on the weekly chart, Solana SOL $84.51 24h volatility: 3.4% Market cap: $48.13 B Vol. 24h: $4.93 B meme coin BONK BONK $0.000006 24h volatility: 0.1% Market cap: $523.99 M Vol. 24h: $67.46 M has grabbed investors’ attention, driven mainly by the ETF hype and a powerful technical chart setup.
With a potential Golden Cross nearing, analysts are wondering whether this bullish rally can continue from here onwards.
BONK Undergoes a Year-Long Accumulation
According to the blockchain analytics firm Arkham Intelligence, BONK has witnessed a year-long accumulation, leaving exchanges. This shows that the selling pressure from the Solana meme coin has dropped significantly.

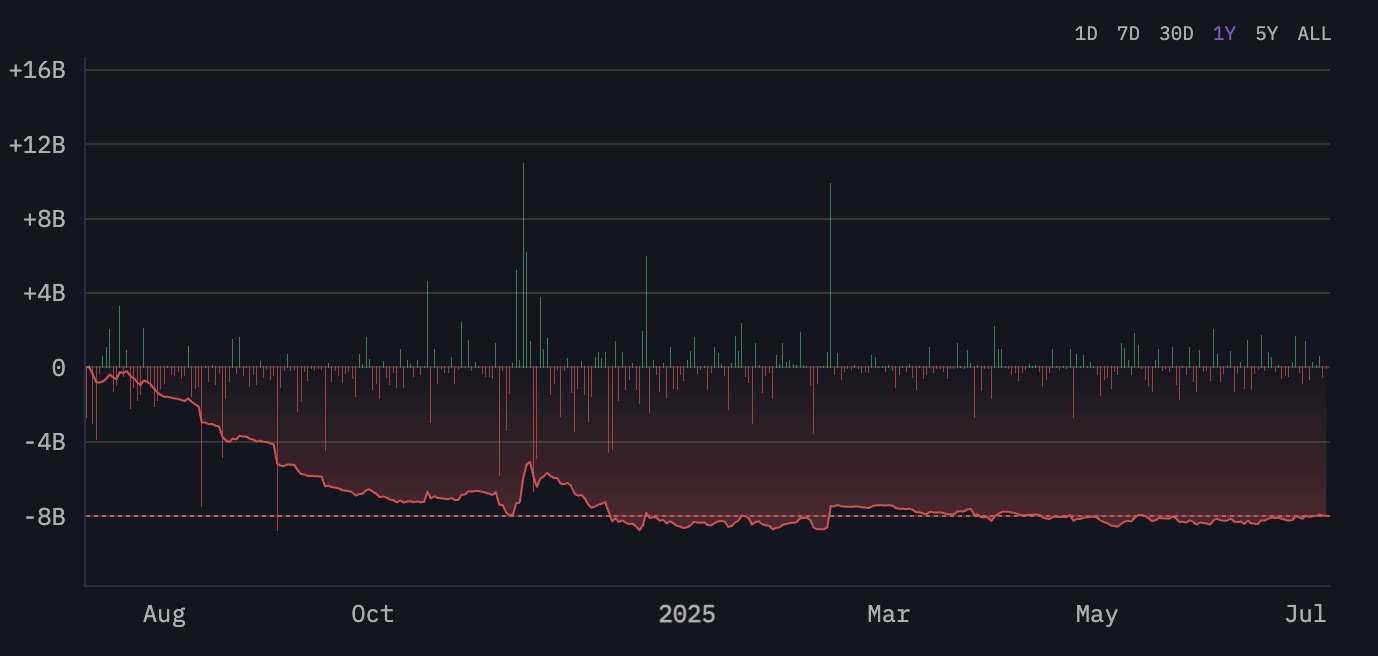
BONK Faces Exchange Outflows – Source: Arkham Intelligence
With its strong gains over the past week, BONK ranks among the top Solana meme coins right now.
Two major factors are driving BONK’s recent price movement. First, growing anticipation surrounds the launch of a 2x leveraged BONK ETF, which Tuttle Capital Management confirmed could debut as early as July 16, pending regulatory approval.
Second, BONK is closing in on a key community milestone: 1 million holders. This milestone would be followed by the burning of 1 trillion BONK tokens, which would trigger upward price pressure with the drop in circulating supply.
Technical Chart and Golden Cross Formation
BONK has officially broken out of a year-long falling wedge pattern on the daily chart, signaling a potential shift in trend. The token is currently consolidating around $0.00002203, just below a key resistance zone at $0.00002389.

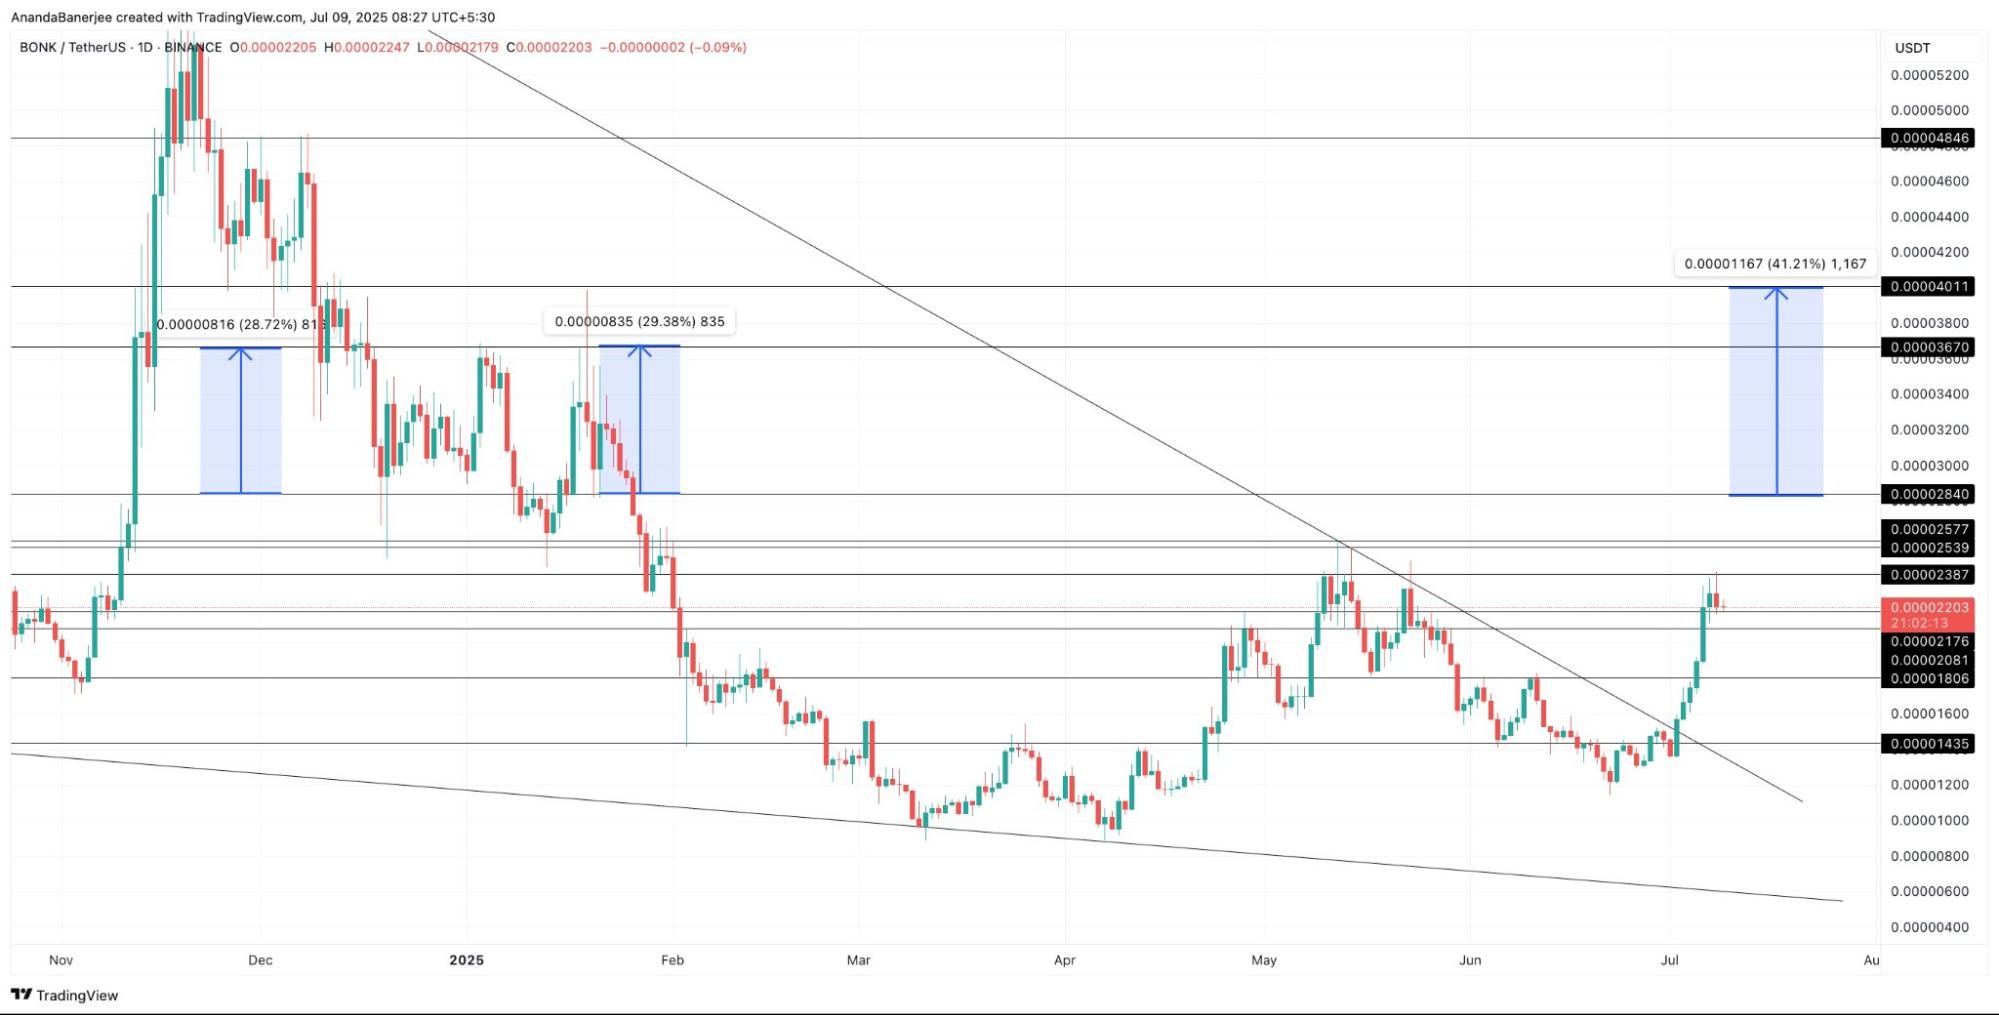
BONK Price Breakout – source: TradingView
A breakout above this level, especially with strong trading volume, could open the door to further upside. The next short-term resistance stands at $0.00002577. Beyond that, bullish targets are set at $0.00002840 and $0.00003670.
Another key technical signal to watch for BONK is the impending Golden Cross, where the 50-day Exponential Moving Average (EMA) is set to cross above the 200-day EMA.
This formation, often viewed as a strong bullish indicator, reflects growing upward momentum as the shorter-term trend overtakes the long-term average.
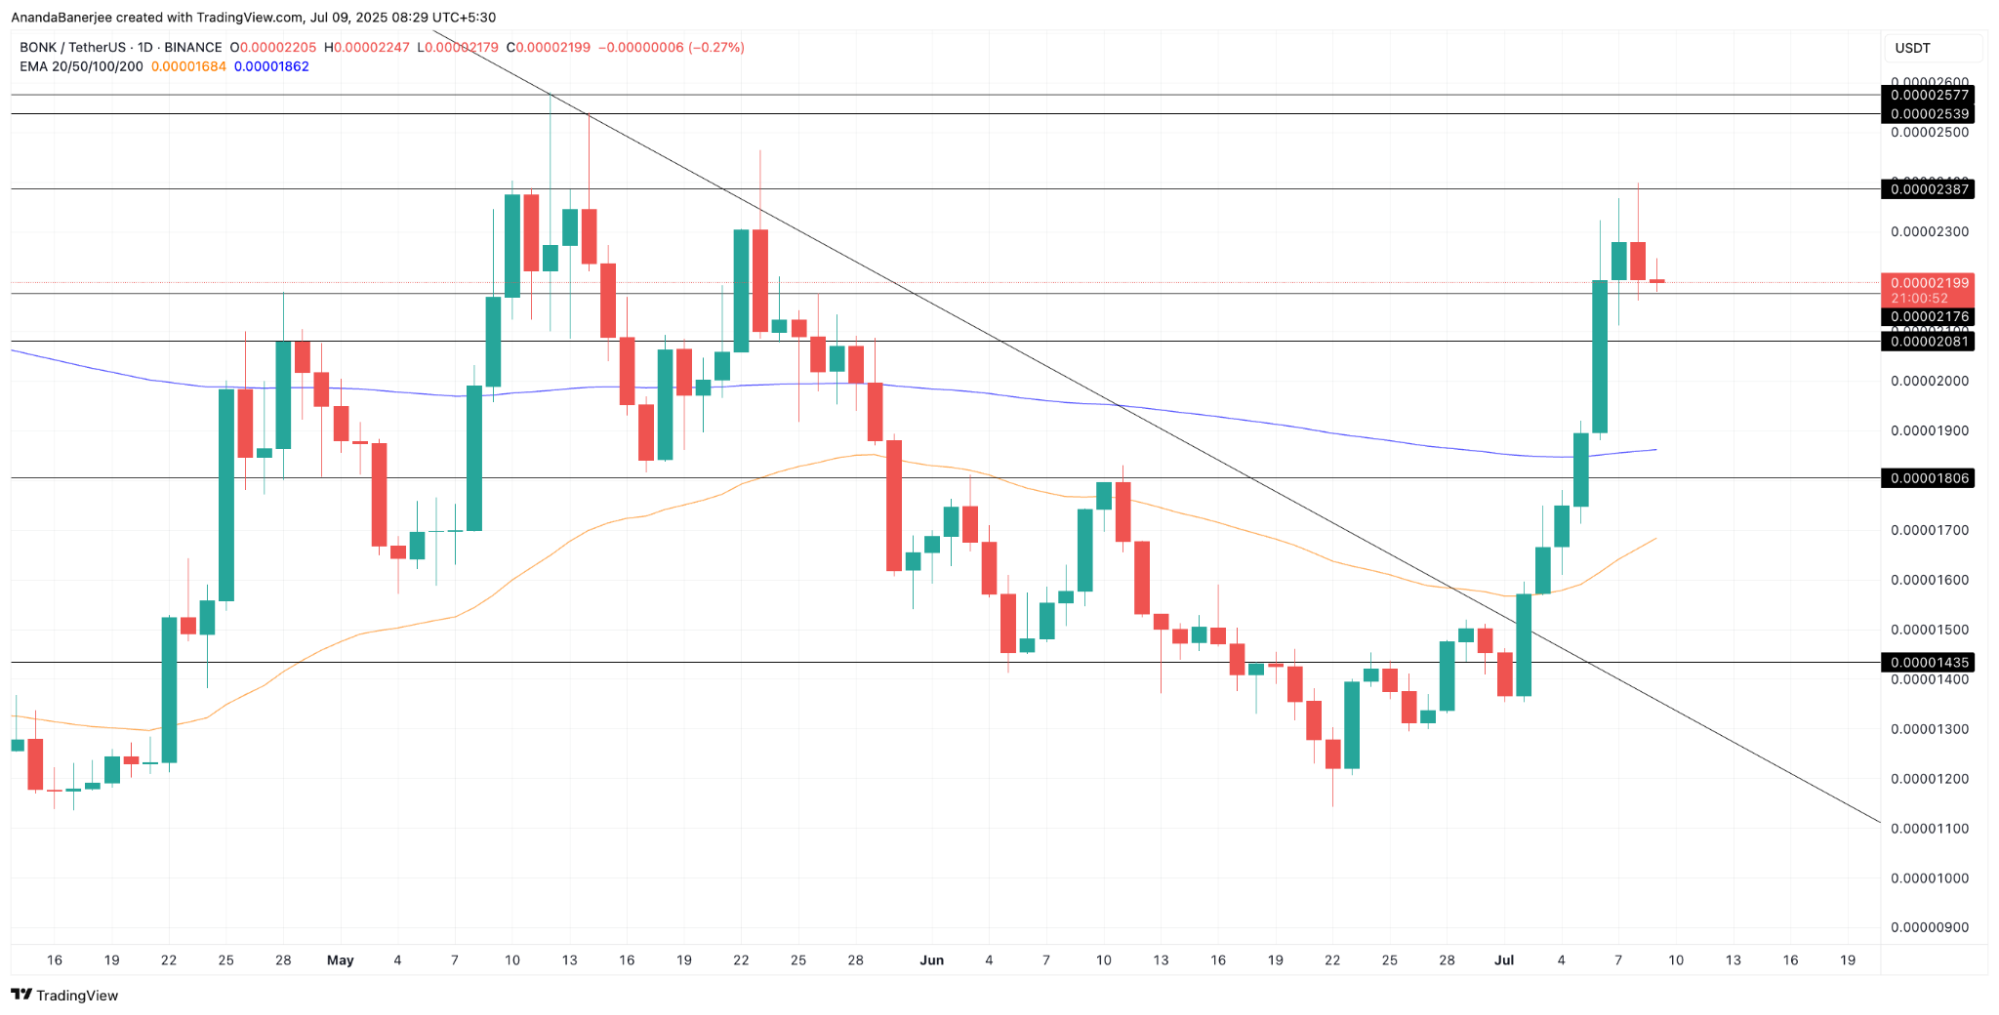
BONK Chart Shows Golden Cross Setup – source: TradingView
If confirmed in the coming days, the crossover could fuel further upside for BONK, potentially clearing resistance at $0.00002840 and setting the stage for a rally toward $0.00003600 or beyond.
next