
XRP has formed a head-and-shoulders pattern on the weekly chart which suggests a potential surge to $3 if bulls take over.
XRP XRP $1.42 24h volatility: 0.8% Market cap: $86.37 B Vol. 24h: $2.54 B , the fourth-largest digital asset, is currently at a crucial juncture, with technical indicators and legal developments shaping its price action.
Prominent analyst Ali Martinez identified a head-and-shoulders pattern on XRP’s weekly chart and noted that it is crucial for the altcoin to hold the $2 support level.
If this level holds, the XRP price could see a bullish rebound, potentially targeting previous resistance levels around $2.60 and $3.
However, a breakdown below this level could lead to significant losses, with the next major support at $1.25, aligning with the height of the pattern’s head subtracted from the neckline.
XRP Price to $70?
On the other hand, analyst EGRAG CRYPTO presented a bold case for XRP’s long-term potential, predicting a surge to $70 based on historical market cycles and mathematical models.
Their analysis is based on previous cycles, the current cycle, application of percentage-based price movement calculations, identification of possible corrections, and target confirmations using indicators.
Additionally, the ongoing SEC vs. Ripple lawsuit appears to be nearing resolution, which could affect XRP’s regulatory status and investor sentiment.
Market participant Andrew cited two sources who claim that the SEC vs. Ripple case is close to resolution, with SEC insiders hinting at a greatly reduced fine for Ripple and potential recognition of XRP as a commodity.
If confirmed, this could be a game-changer, significantly improving XRP’s regulatory clarity and boosting investor confidence.
XRP Price Analysis
Currently trading at $2.34 with a 2% daily increase, XRP is showing signs of consolidation, according to CoinMarketCap data.
The Relative Strength Index (RSI) stands at 48.56, suggesting neutral momentum. If RSI crosses 50, a bullish breakout might be possible. The gradient of the RSI line shows an uptick in buying pressure in the short term as well.

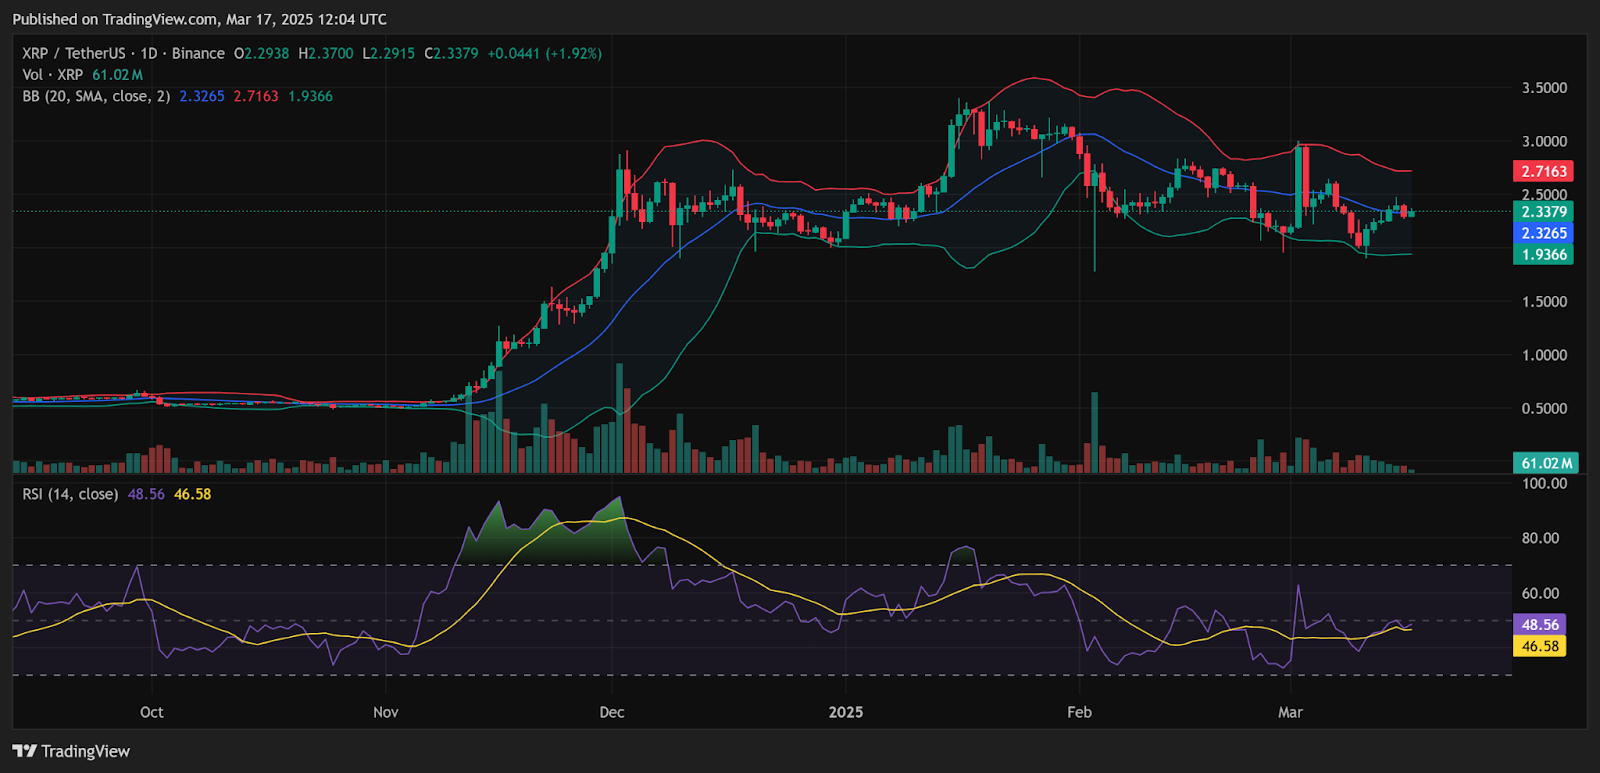
Meanwhile, XRP price is near the middle Bollinger Band ($2.33). A move above the upper band ($2.72) would confirm a bullish trend, while a drop below the lower band ($1.93) could signal further downside.
next