XRP Price Analysis: XRP/USD Remains Near $0.31 Price Level, Targets $0.32

Updated on Apr 28, 2022 at 11:28 am UTC by · 2 mins read

XRP price will rally towards $0.32 resistance level in case the bullish momentum breakup the resistance level of $0.31 and the bullish candle closes above the level, otherwise, the coin will return to its previous low in case $0.31 supply level holds.

Key Highlights:

  • Sideways movement confirmed in the XRP market;
  • the bears took over the XRP market;
  • the coin may target $0.32 price level.

XRP/USD Price Medium-term Trend: Ranging

Supply levels: $0.31, $0.32, $0.33
Demand levels: $0.30, $0.28, $0.26XRP is ranging on the medium-term outlook. The cryptocurrency found support at the demand level of $0.30 on March 26. The Morning star candle pattern formed at $0.30 level; this candle pattern is a bullish reversal candle pattern. The Bulls pushed up the XRP price towards $0.31 resistance level. The Bulls lost the momentum likewise the bears, the sideways movement began on and around $0.31 level.

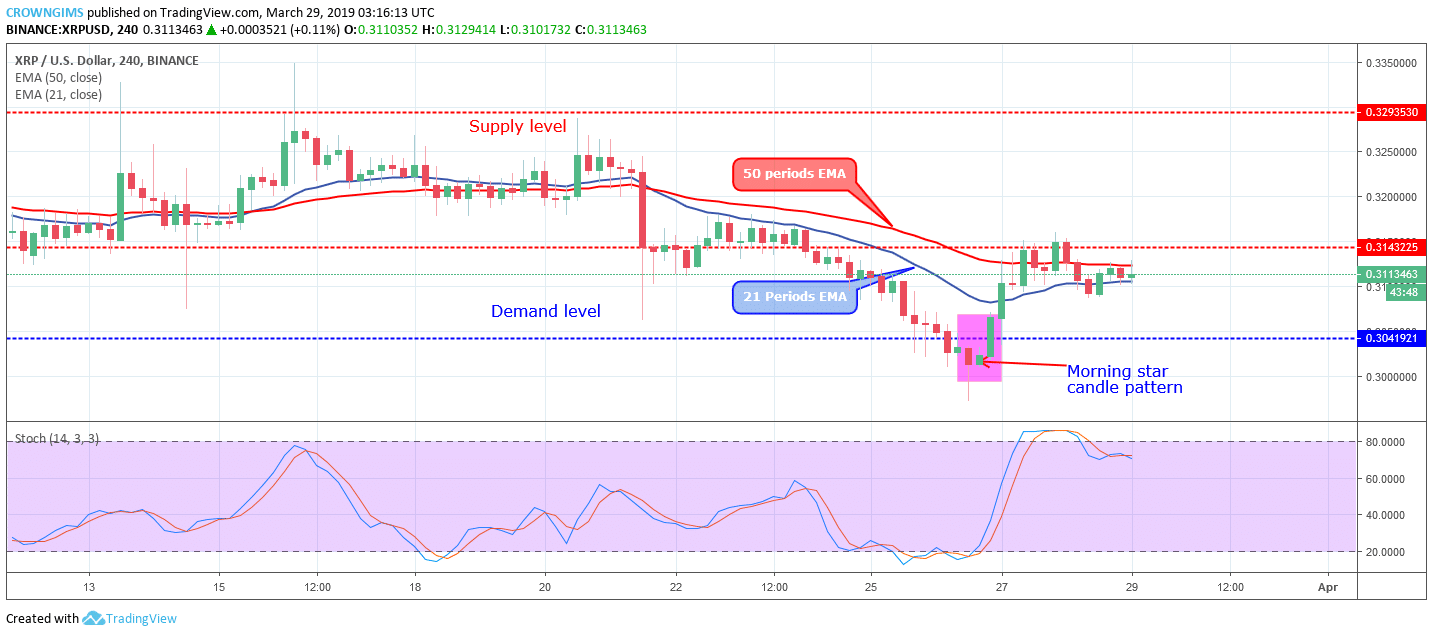
The two EMAs are coming closer to each other and the coin is trading on and in-between the 21 periods EMA and 50 periods EMA which connotes that consolidation is ongoing in the XRP market. The Stochastic Oscillator period 14 is close to 80 levels with the signal lines twisting to each other also confirm the sideways movement which may continue for a while.

XRP price will rally towards $0.32 resistance level in case the bullish momentum breakup the resistance level of $0.31 and the bullish candle closes above the level, otherwise, the coin will return to its previous low in case $0.31 supply level holds.

XRP/USD Price Short-term Trend: Ranging

On the short-term, XRP/USD is on the sideways movement. The bullish momentum pushed the XRP to the high of $0.31 on March 27. The bulls could not push up the XRP price beyond this level before the Bears took over. Bearish harami candle pattern formed; which is a bearish reversal candle. XRP price declined towards the $0.30 demand level but could not reach the mark before it was interrupted by the Bulls and the sideways movement began.

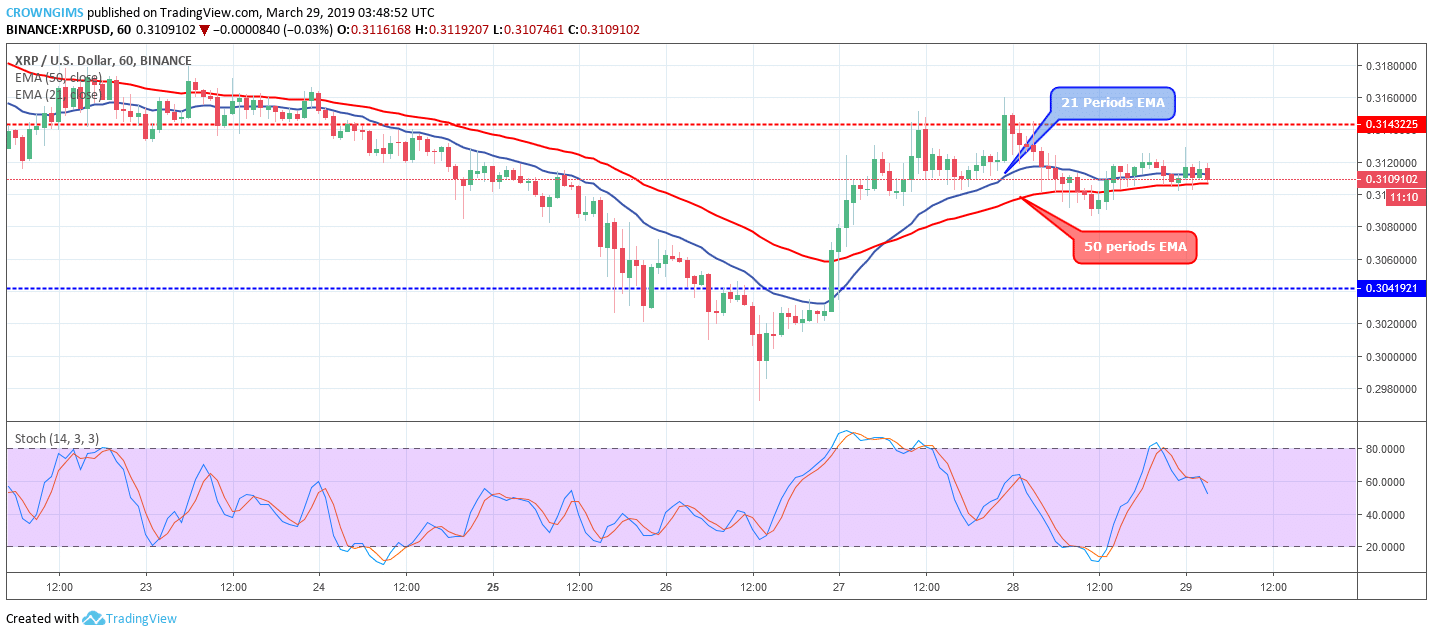
The coin is hovering over the 21 periods EMA and 50 periods EMA. The two EMA are flat horizontally in the XRP market on the 1-hour chart. However, the Stochastic Oscillator is at 60 levels with the signal lines bending down which connotes sell signal.

*To learn more about XRP coin, Ripple company, and their innovative solutions, please check out our awesome Ripple guide.

Share:

Related Articles

Litecoin, Solana Have Higher Chance of ETF Approval Than XRP: Here’s Why

By April 30th, 2025

Litecoin and Solana might see their spot exchange-traded products enter the US market earlier than most of the anticipated XRP ETFs.

XRP Breaks 3-Year Negative Growth Trend, Here Are Key Drivers

By April 29th, 2025

XRP ends its 3-year April slump with a strong rebound, fueled by ETF buzz and Ripple ecosystem gains.

Will XRP Explode after April 30? New Futures ETFs Could Send Price Flying – Price Prediction

By April 28th, 2025

XRP could be on the brink of a major breakout, with a critical catalyst just days away.

Exit mobile version