
The demand level of $0.25 may be the bears’ target. In case the demand level of $0.25 holds and the XRP price bounce, an upward trend may be experienced with $0.38 – $0.43 as its target.
Key Highlights:
- The Bears pressure sustained in the XRP market;
- the demand level of $0.25 may be the bears’ target;
- bearish trend is ongoing.
XRP/USD Price Long-term Trend: Bearish
Supply levels: $0.32, $0.38, $0.43
Demand levels: $0.25, $0.20, $0.16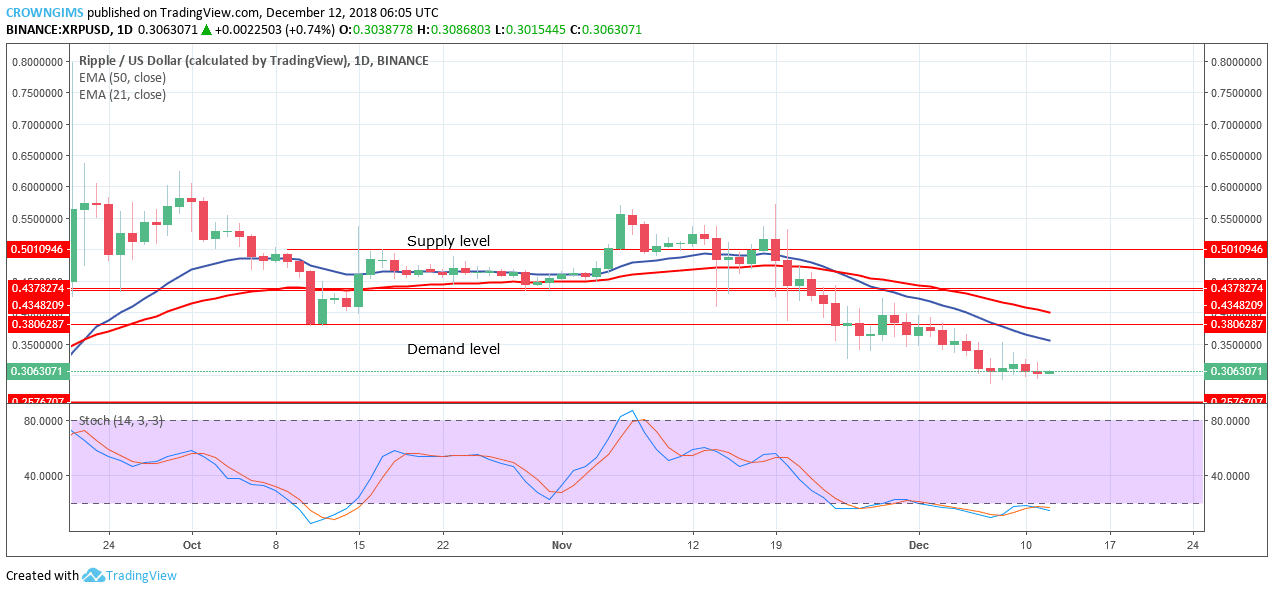

There was a retracement to the upside towards $0.38 supply area on December 8. Rejection to further upward move was seen around the 21-day EMA as the bears gradually returned after the market correction.
XRP is currently consolidating below the demand level of $0.32and it is trading under 21-day EMA and 50-day EMA indicating the bears’ pressure. The Stochastic Oscillator period 14 is in the oversold region with its signal lines pointing downward which suggests downward momentum in XRP market. $0.25 may be the bears’ target. In case the demand level of $0.25 holds and the price bounce, an upward trend may be experienced with $0.38 – $0.43 as its target.
XRP/USD Price Medium-term Trend: Bearish
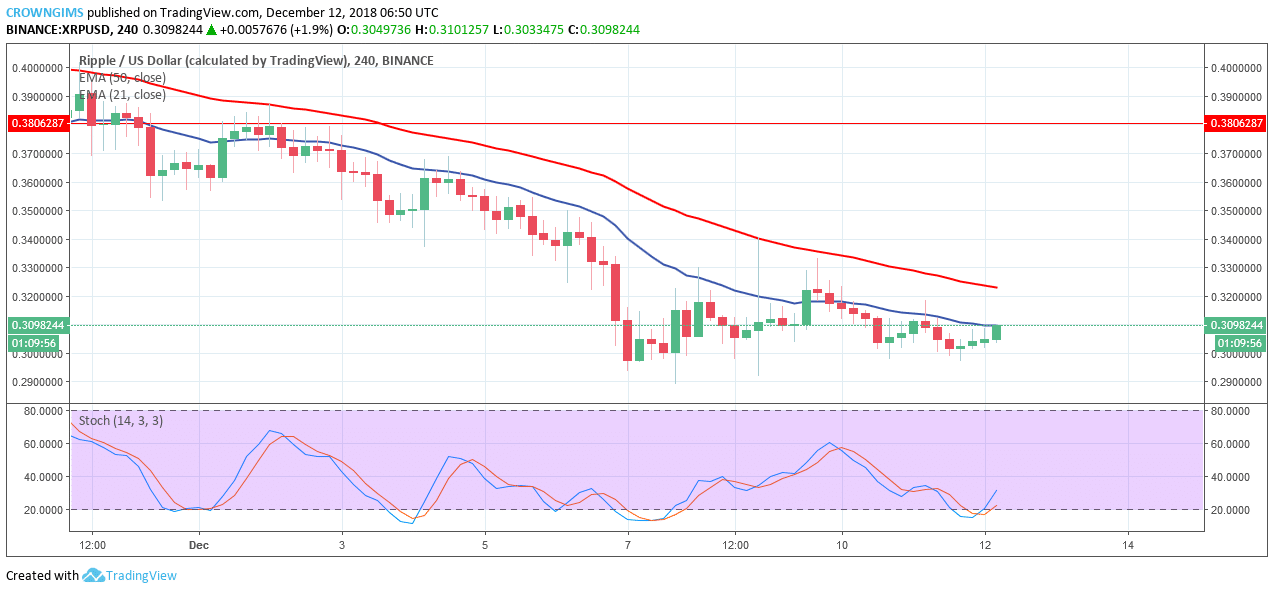
XRP continues in its bearish trend on the 4-Hour chart. XRP price found its low around $0.25 demand level on December 7, rejection to further downward move was carried out by the bulls, the price was pushed up towards the 50-day EMA where the further upward movement was resisted and the price is moving sideways around the two EMAs.
XRP price is below the two EMAs with the 21-day EMA and 50-day EMA acting as a strong resistance against upward price movement. The stochastic oscillator is at 20 levels (the oversold region) with its signal lines pointing upward which indicates buy signal.
To learn more about XRP coin, Ripple company and their innovative solutions, please check out our awesome guide.
next