XRP Price Analysis: XRP/USD Trends of February 06–12, 2019

Updated on Apr 28, 2022 at 11:17 am UTC by · 2 mins read

XRP price will found its low at $0.25 demand level in case the historical demand level of $0.28 does not hold, should the mentioned demand level holds, the coin will experience uptrend movement towards $0.38 price level.

Key Highlights:

  • The bearish trend may continue in the XRP market;
  • the bullish trend will be experienced in case $0.28 level holds;
  • the breaking of $0.28 price level will expose $0.25 price level.

XRP/USD Price Long-term Trend: Bearish

Supply levels: $0.33, $0.38, $0.42
Demand levels: $0.28, $0.25, $0.22XRP Price Analysis: XRP/USD Trends of February 06–12, 2019XRP/USD remains bearish on the long-term outlook. The cryptocurrency found its support on the demand level of $0.28 on 29th of January; the bears lost its momentum and could not break down the level. The bulls came into the XRP market; this is noticed with the formation of a strong bullish candle which pushed the XRP price up towards the supply level of $0.33 but unable to penetrate the barrier and it was resisted by the dynamic resistance of 50-day EMA. The bears pushed the XRP price back to its previous low of $0.28 where is currently making attempt to break.

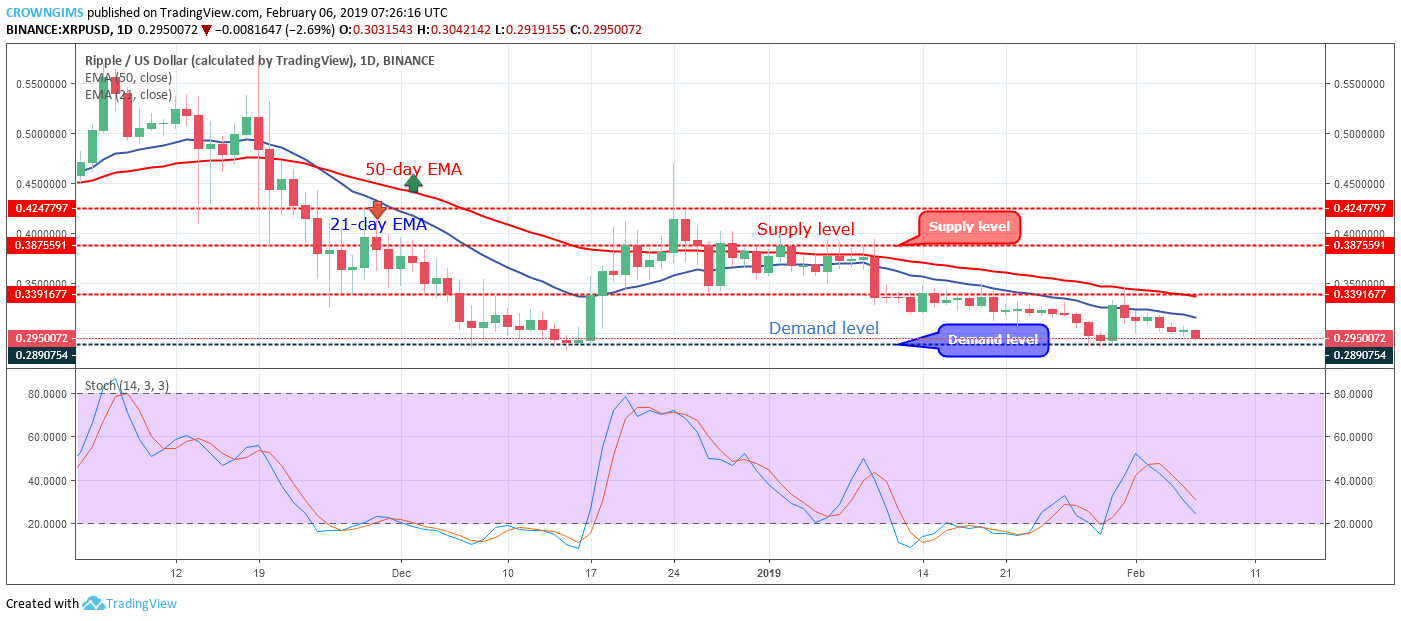
The 50-days EMA is still above the 21-day EMA and the XRPUSD price is trading below the 21-day EMA as a bearish momentum indication which may likely continue as more bearish candle are shooting down. The Stochastic Oscillator period 14 is above 30 levels with the signal lines pointing down indicates sell signal.

The XRP price will found its low at $0.25 demand level in case the historical demand level of $0.28 does not hold, should the mentioned demand level holds, the coin will experience uptrend movement towards $0.38 price level.

XRP/USD Price Medium-term Trend: Bearish

XRP Price Analysis: XRP/USD Trends of February 06–12, 2019On the medium-term outlook, XRP/USD continues on the bearish trend. On January 29, XRP price reached the low of $0.28 price level but unable break down the level. The inside bar candle formed as a sign of bulls’ momentum pushed the coin up and rallied towards $0.33 supply level after penetrated the two dynamic support and resistance level. The bulls’ momentum was exhausted and the evening star candle pattern formed which is reducing the XRP price to its previous low currently.

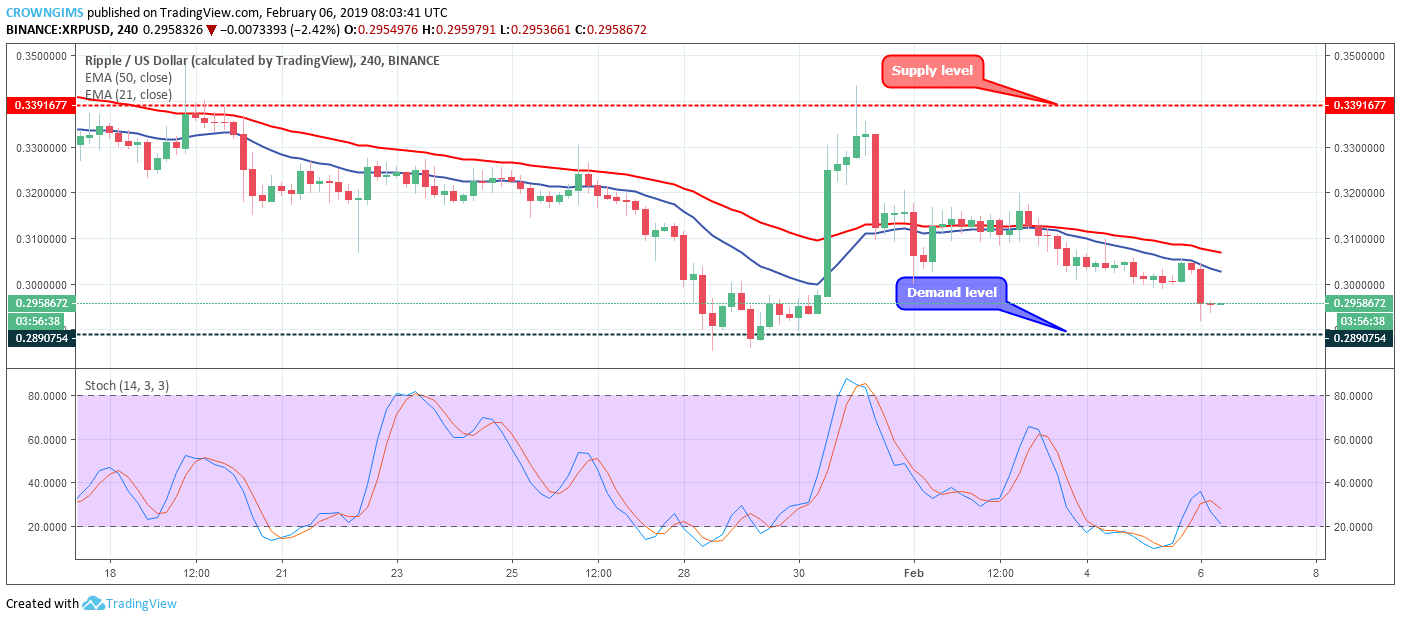
The cryptos are still trading under the 21-day EMA and 50-day EMA and the Stochastic Oscillator period 14 is above 20 levels with its signal lines pointing towards south which indicates sell signal and the bearish trend may continue.

To learn more about XRP coin, Ripple company, and their innovative solutions, please check out our awesome guide.

Share:

Related Articles

XRP Ledger (XRPL) Welcomes Latest Update, Here’s What Changed

By June 25th, 2025

RippleX has announced the release of a new iteration of the XRP Ledger, XRPL version 2.5.0, which includes some amendments and bug fixes.

Ripple (XRP) Price Prediction: Head and Shoulders Pattern Flashes 30% Breakdown Signal

By June 23rd, 2025

XRP broke below the critical $2 level on Monday, marking its lowest point in 75 days amid legal uncertainty and global market pressure. A Head and Shoulders pattern suggests further downside risk to $1.50.

Bloomberg Analysts Revises XRP and Cardano ETF Approval Odds to 90%

By June 21st, 2025

Eric Balchunas and James Seyffart have raised the odds of XRP, DOGE, and ADA ETFs to 90% following the SEC’s perceived positive sentiment.

Exit mobile version