In case the Demand level of $0.31 holds and the Bulls gain enough pressure, the XRP price will range towards $0.34 – $0.38. On the other side, the penetration of the $0.31 price level downside will make the XRP find its support at $0.28 demand level.
Key Highlights:
- Sideways movement confirmed in the XRP market;
- in case $0.31 price level holds, the target may be $0.38;
- the bears are taking over on 4-Hour chart.
XRP/USD Price Long-term Trend: Ranging
Supply levels: $0.34, $0.38, $0.42
Demand levels: $0.31, $0.28, $0.25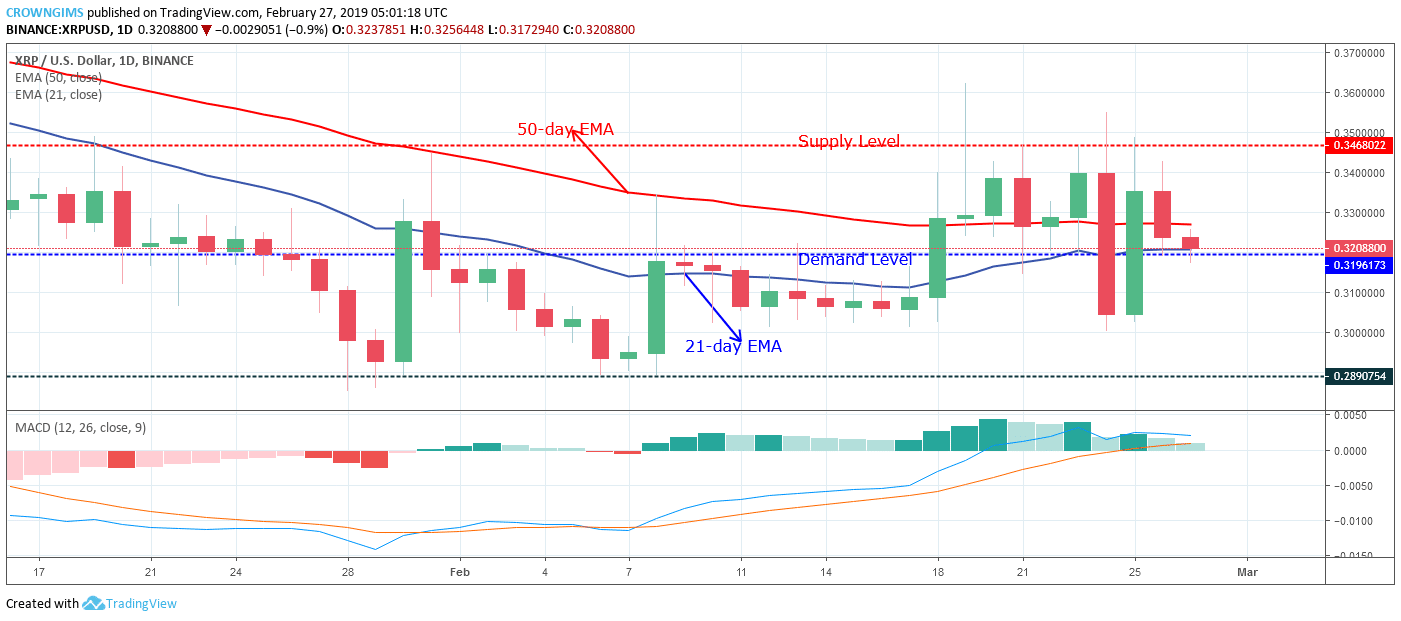

The Bulls gained momentum and broke up the $0.34 price level twice. Increase in XRP price was rejected by the bears and the XRP price declined towards the demand level of $0.28 by the formation of a massive strong bearish candle that broke down the $0.31 price level. The bulls equally opposed the declination of XRP price by the formation of a massive bullish candle which placed the coin above the $0.31 price level.
Throughout last week, the coin was range bound within the supply level of $0.34 and the demand level of $0.31. The two EMAs is currently close to each other, horizontally flat showing no direction and the XRP is hovering over the 21-day EMA and 50-day EMA which indicates that sideways movement is ongoing in the XRP market.
The MACD period 12 with its histogram is above the zero levels and the signal lines flat on the zero levels, this confirms the ranging market.
The crypto is directly facing the demand level of $0.31. In case the Demand level of $0.31 holds and the Bulls gain enough pressure, the XRP price will range towards $0.34 – $0.38. On the other side, the penetration of the $0.31 price level downside will make the XRP find its support at $0.28 demand level.
XRP/USD Price Medium-term Trend: Bearish
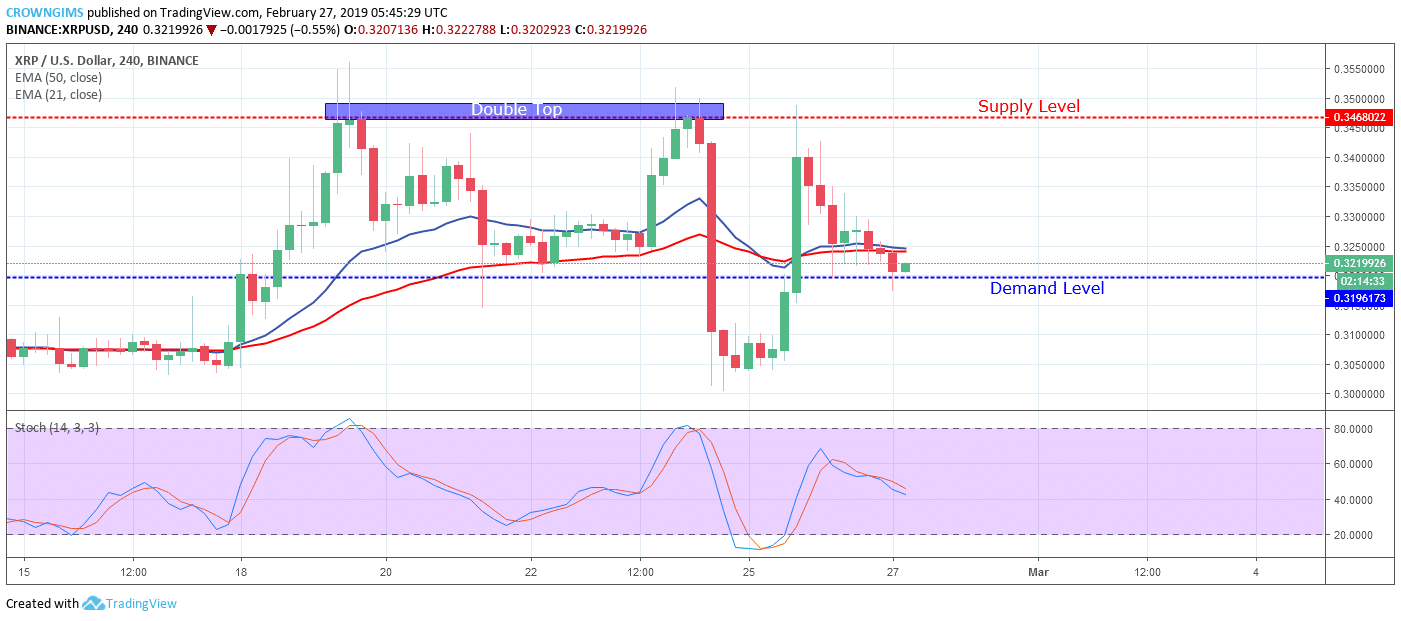
The Bullish momentum returned the XRP price towards the $0.34 price level but unable to break it up due to the loss in pressure. The bears are currently in control of XRP price on 4-Hour chart. The Stochastic Oscillator is at 40 levels with the signal lines pointing down indicates sell signal.
*To learn more about XRP coin, Ripple company, and their innovative solutions, please check out our awesome guide.
next