XRP Price Analysis: XRP/USD Trends of January 23–29, 2019

Updated on Apr 28, 2022 at 11:16 am UTC by · 2 mins read

In case the XRP price declines to the previous low of $0.28 and the price bounces then the traders should look for an opportunity to place a long position and take their profit at $0.38 price level.

Key Highlights:

  • Another ranging movement on the XRP market;
  • the bears still hold control of the market;
  • traders should exercise patient before placing a trade.

XRP/USD Price Long-term Trend: Ranging

Supply levels: $0.33, $0.38, $0.42
Demand levels: $0.28, $0.25, $0.22On the long-term outlook, XRP/USD resumes another range-bound movement. Another sideways movement commenced shortly after the coin broke out of the sideways movement that took place on December 27 till January 10 by the big bearish candle that broke down the former demand level of $0.33. The XRP price started consolidating below the $0.33 price level. The XRP price will remain on this state of consolidation until there is a breakout on either side of the range level.

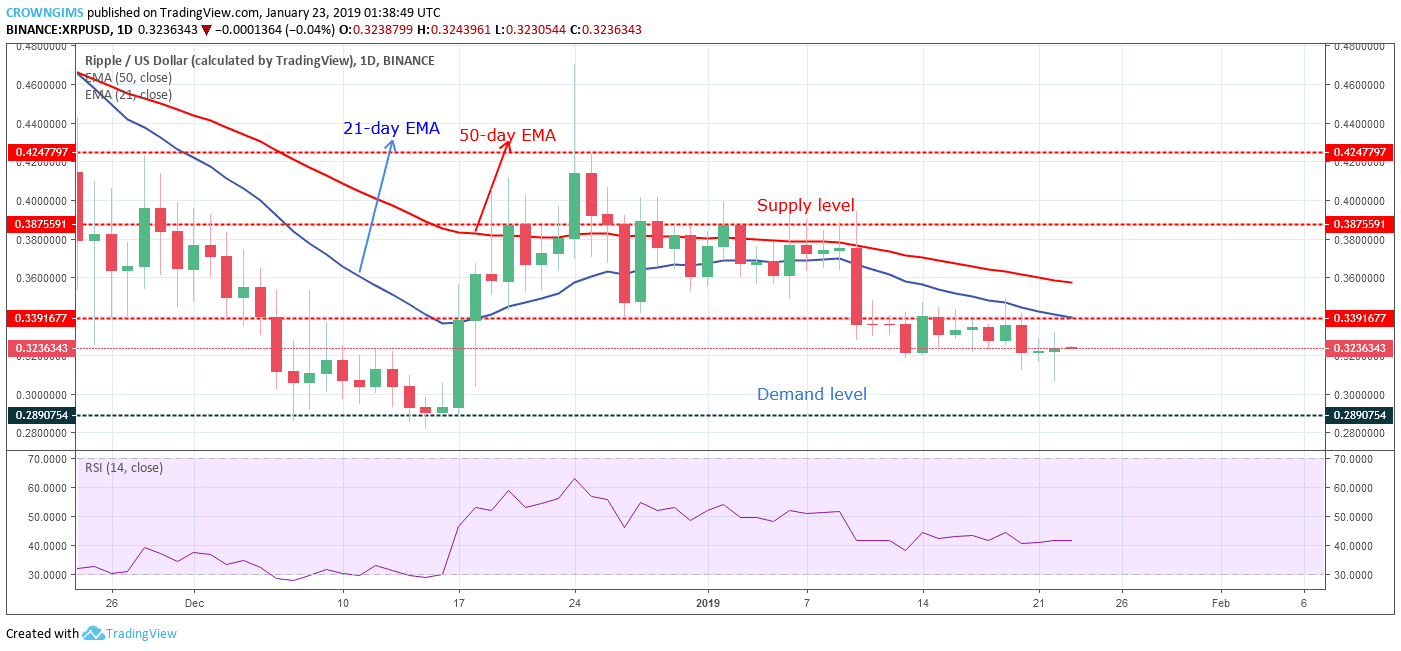
The $0.28 demand level is already been exposed. XRP price is trading below the 21-day EMA and 50-day EMA and the two EMAs are fanned apart which indicate the bearish pressure in the XRP market. Should the bears defend the supply level of $0.33 the coin may fall to the $0.25 price level. In case the XRP price decline to the previous low of $0.28 and the price bounces then the traders should look for an opportunity to place a long position and take their profit at $0.38 price level.

The Relative Strength Index period 14 is at 40 levels flat horizontally at the level implies that the consolidation movement may continue for a short period of time.

XRP/USD Price Medium-term Trend: Bearish

XRP/USD is on the bearish trend on the medium-term outlook. The cryptos maintain its bearish trend last week. The bulls made attempts to break up the supply level of $0.33 on January 19 but were resisted and the coin resumed its bearish trend. Currently, the XRP price is below the 21-day EMA and the 50-day EMA is above the two.

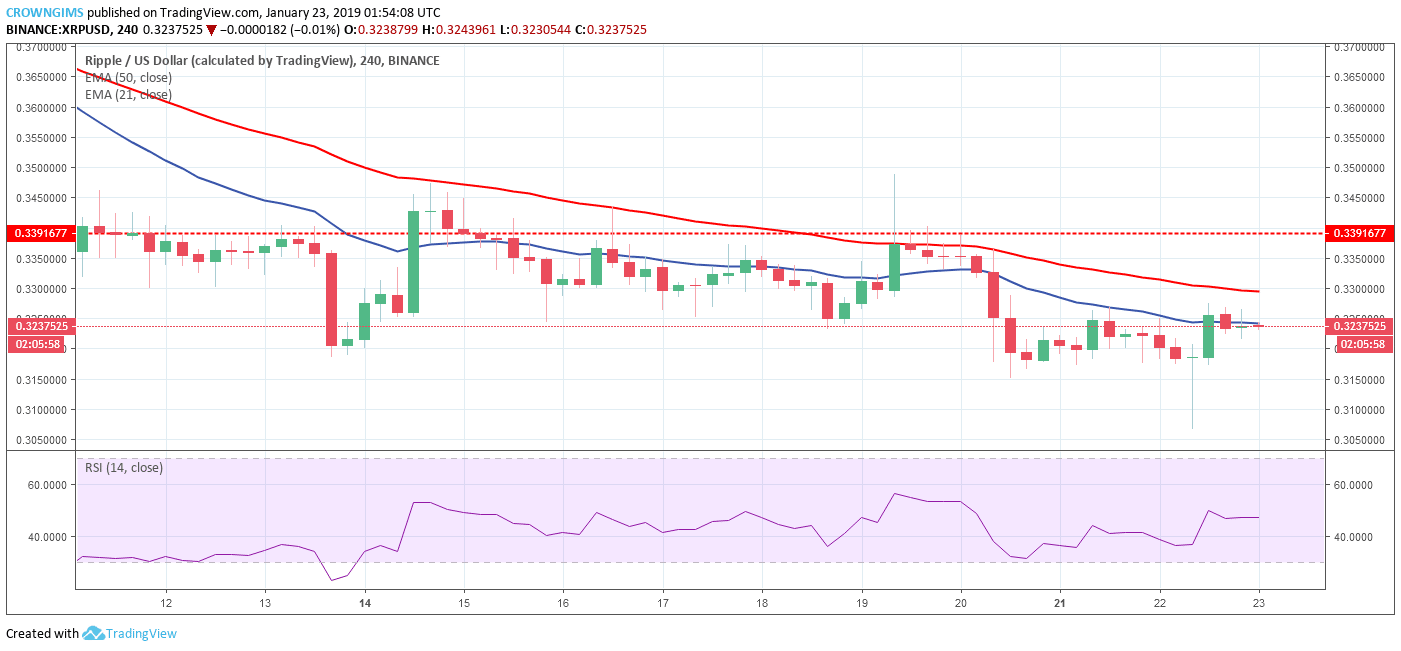
The Relative Strength Index period 14 is at 50 levels horizontally flat at the level without showing direction indicates that ranging movement is ongoing and may take few hours before the breakout.

*To learn more about XRP coin, Ripple company and their innovative solutions, please check out our awesome guide.

Share:

Related Articles

Litecoin, Solana Have Higher Chance of ETF Approval Than XRP: Here’s Why

By April 30th, 2025

Litecoin and Solana might see their spot exchange-traded products enter the US market earlier than most of the anticipated XRP ETFs.

XRP Breaks 3-Year Negative Growth Trend, Here Are Key Drivers

By April 29th, 2025

XRP ends its 3-year April slump with a strong rebound, fueled by ETF buzz and Ripple ecosystem gains.

Will XRP Explode after April 30? New Futures ETFs Could Send Price Flying – Price Prediction

By April 28th, 2025

XRP could be on the brink of a major breakout, with a critical catalyst just days away.

Exit mobile version