
The continuation of the bullish trend is highly envisaged; if the Bulls maintain or increase their pressure XRP price may break up $0.33 supply level and target $0.34. Sideways movement may continue at this level in case the bears defend the $0.33 level.
Key Highlights:
- The Bears are still in control of the XRP market;
- the Bears’ pressure may push the XRP price down to $0.27 demand level;
- the pullback is inevitable in the XRP market.
XRP/USD Price Medium-term Trend: Bullish
Supply levels: $0.33, $0.34, $0.36
Demand levels: $0.31, $0.30, $0.28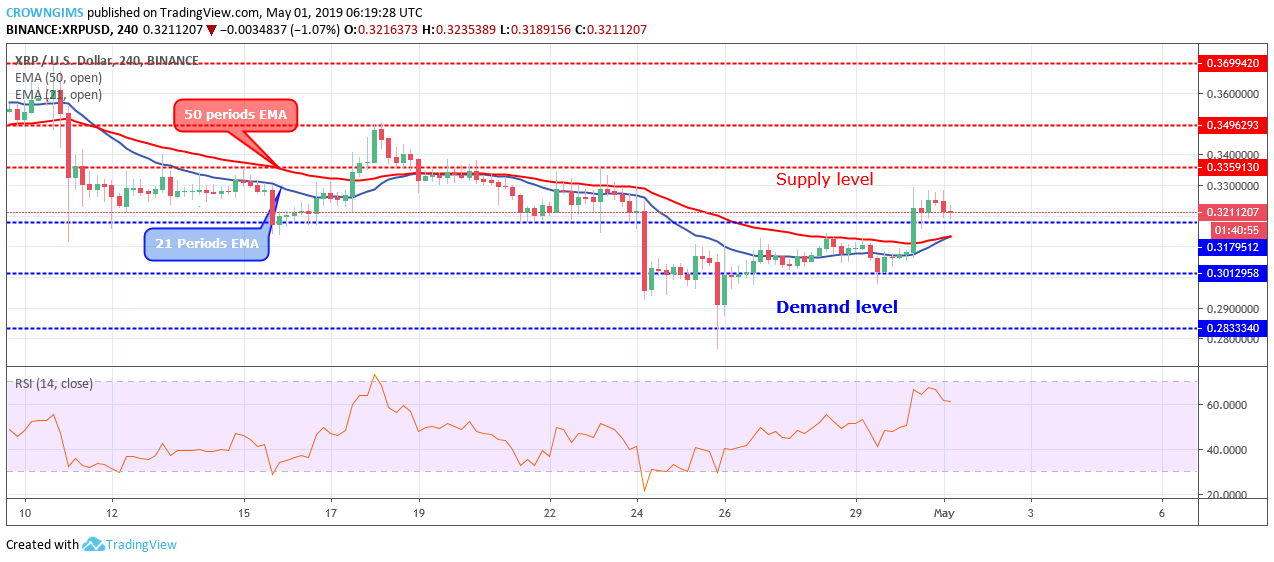

The coin started a sideways movement within the range of $0.30 and $0.31 price level. On April 30, the Bulls increased their pressure and this was seen on the 4-hour chart with the formation of Strong bullish candle which penetrated the barrier at $0.31 and put the price above the price level.
XRP price has penetrated the two EMAs and currently trading above the 21 periods EMA and 50 periods EMA. The Relative Strength Index period 14 is above 60 levels with the signal lines pointing down to indicate a sell signal.
The continuation of the bullish trend is highly envisaged; should the Bulls maintain or increase their pressure the coin may break up the $0.33 supply level and target $0.34 level. Sideways movement may continue at this level in case the bears defend the $0.33 level.
XRP/USD Price Short-term Trend: Bullish
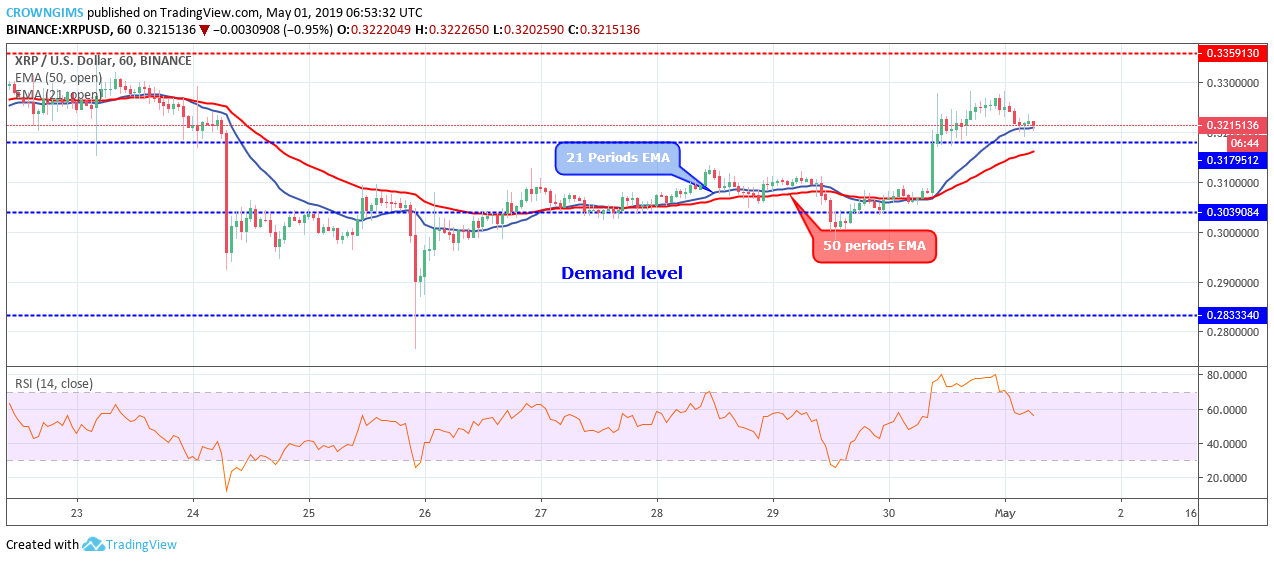
There was a breakout at $0.31on April 30 and the price is placed above the just mentioned level. The Relative Strength period 14 is below 60 and the signal lines bending down to connote sell signal which may be a pullback.
next