After the short pullback, XRP price may continue the bearish trend, $0.39 demand level may be broken and the pair may target $0.35 demand level. In case the demand level of $0.39 hold, the price may reverse and rally to the north side.
Key Highlights:
- The Bulls may take over the XRP market;
- XRP price may reverse at $0.39 level;
- the price may continue its bearish trend after a pullback.
XRP/USD Price Medium-term Trend: Bearish
Supply levels: $0.42, $0.46, $0.49
Demand levels: $0.39, $0.35, $0.29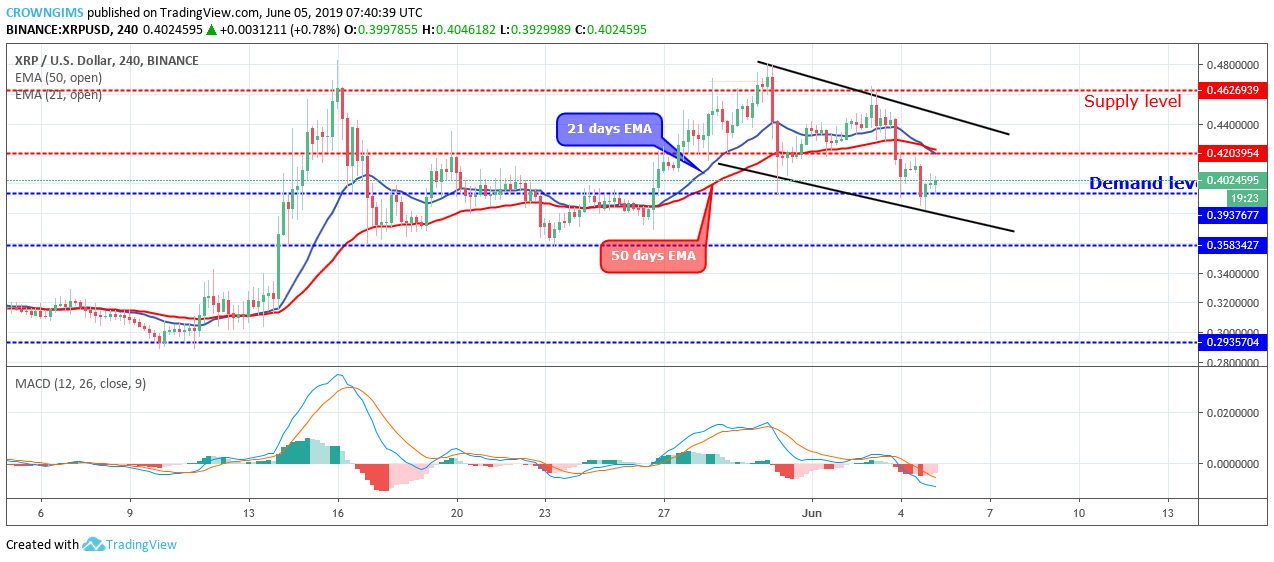

The Bears decided to take over with the formation of Bearish engulfing candle at the same level; this resulted in the declination of XRP/USD price towards $0.42 level, the level did not hold and was broken down side by the Bears. The Bearish trend extended to $0.39 demand level yesterday. It seems the price is carrying out pullback as at the moment.
The 21 periods EMA is crossing 50 periods EMA as an evidence of bearish trend and the XRP/USD are trading below the two EMAs. The Moving Average Convergence Divergence period 12 with its histogram is below zero levels and the signal lines bending down to indicate sell signal.
After the short pullback, the currency pair may continue the bearish trend, $0.39 demand level may be broken and the pair may target $0.35 demand level. In case the demand level of $0.39 hold, the price may reverse and rally to the north side.
XRP/USD Price short-term Trend: Bearish
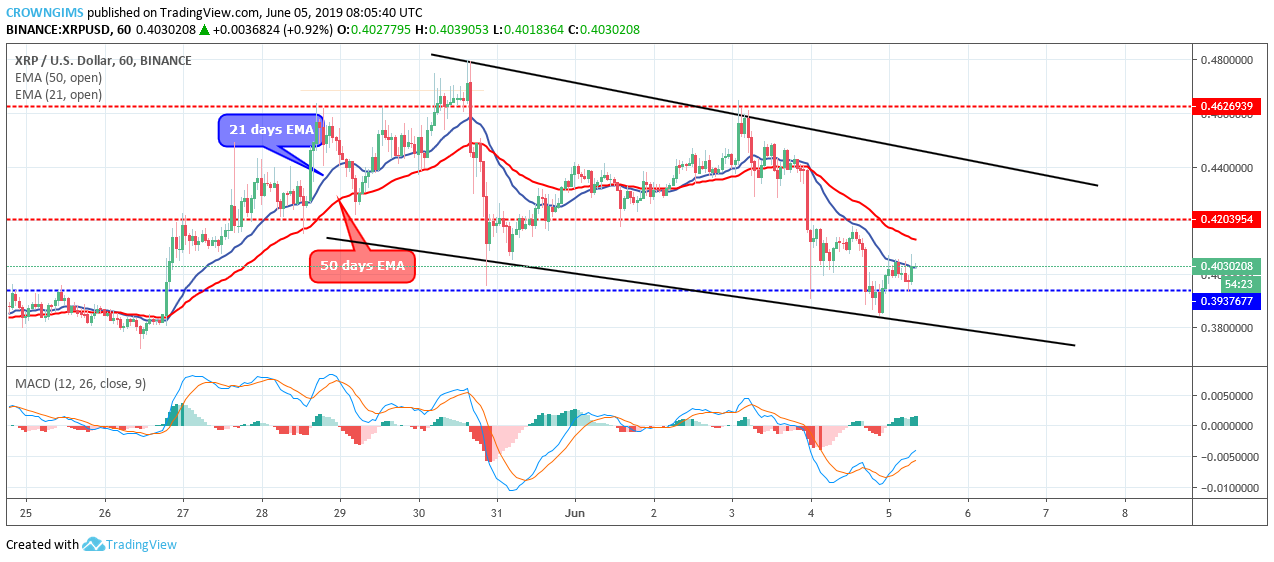
It seems that the price is reversing when it touched the lower trend line of the channel. Meanwhile, the MACD period 12 with its histogram is above zero levels and the signal lines pointing up to indicate buy signal which may rally back to the upper trend line.
next