
In case, the demand zone of $0.53 holds the XRP will rally to the north and the supply zone of $0.61 will be the next target.
Key Highlights:
- XRP price may increase;
- bulls were in control of the market;
- price retracement is inevitable.
XRP/USD Price Long-term Trend: Bullish
Supply levels: $0.61, $0.69, $0.75
Demand levels: $0.53, $0.45, $0.37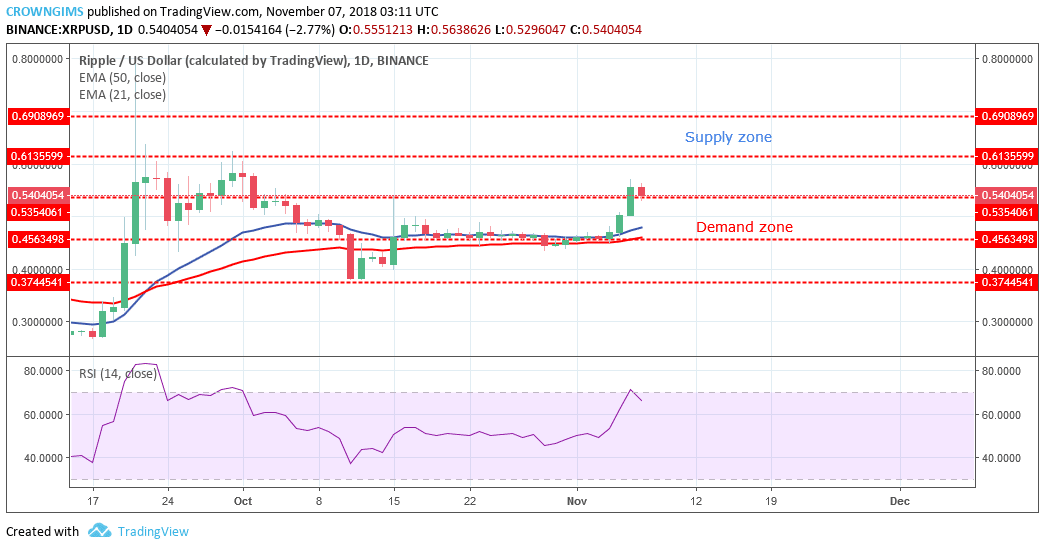

On November 5, the bulls enter the market with high momentum and pushed the pair to the north with the formation of massive bullish candle that broke the former supply zones of $0.53 and exposed the supply zone of $0.61. Currently, there is a sign of price increase rejection which may be price retracement as the daily candle on the daily chart is bearish. In case, the demand zone of $0.53 holds the XRP will rally to the north and the supply zone of $0.61 will be the next target.
XRP price is above 21-day EMA and the 50-day EMA which indicates that the uptrend is ongoing. However, RSI period 14 is at the 70 level pointing towards the south indicates that there are possibilities for downward movement.
XRP/USD Price Medium-term Trend: Bullish
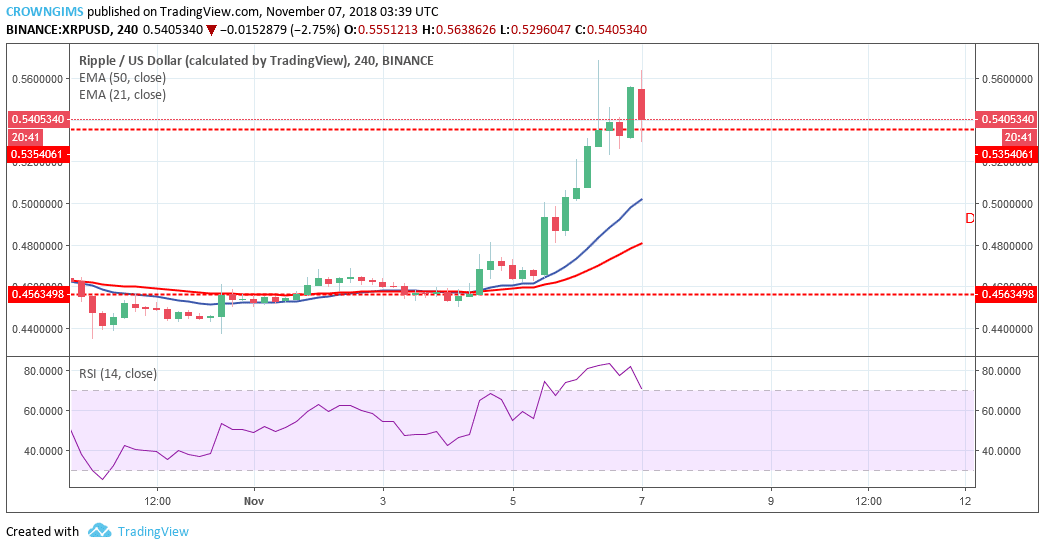
21-day EMA has crossed the 50-day EMA upside and the price is above 21-day EMA and 50-day EMA which indicates uptrend is ongoing.
In case the bears increase their pressure further and break the demand level of $0.53 downside, the demand level of $0.45 will be exposed. The RSI period 14 is at overbought zone with its signal line pointing to the south indicate sell signal.
next