
Binance introduces two new features to boost token transparency, fueling speculation around a potential BNB breakout beyond $1,000.
Binance has recently doubled down its efforts to increase transparency and enhance trading decision-making on its platform. The exchange recently announced the launch of two major features: Token Lock-up Addresses and Holding Concentration Indicators.
These tools are designed to offer users deeper insights into token supply and potential volatility. The Locked Addresses feature enables users to see if a portion of a token’s supply is locked and unavailable for circulation, information that can influence price interpretation and trading strategies.
Meanwhile, the Holding Concentration Indicator provides a snapshot of how much control large holders exert over a cryptocurrency. This helps investors gauge volatility risk based on ownership distribution.
Both features appear in the cryptocurrency’s Info tab and are designed to provide traders with more reliable data.
BNB Price Breakout Hopes
The launch has led to an increased confidence in Binance and its native token, BNB BNB $637.4 24h volatility: 1.5% Market cap: $87.06 B Vol. 24h: $1.29 B . At press time, BNB trades at around $620.6, dipping around 1.11% in the last 24 hours. Despite broader market weakness, BNB has declined just 5% over the past week.
On the weekly chart, BNB continues to trade within a symmetrical triangle since last year, with resistance around the $700–$720 zone and support near $200–$220.
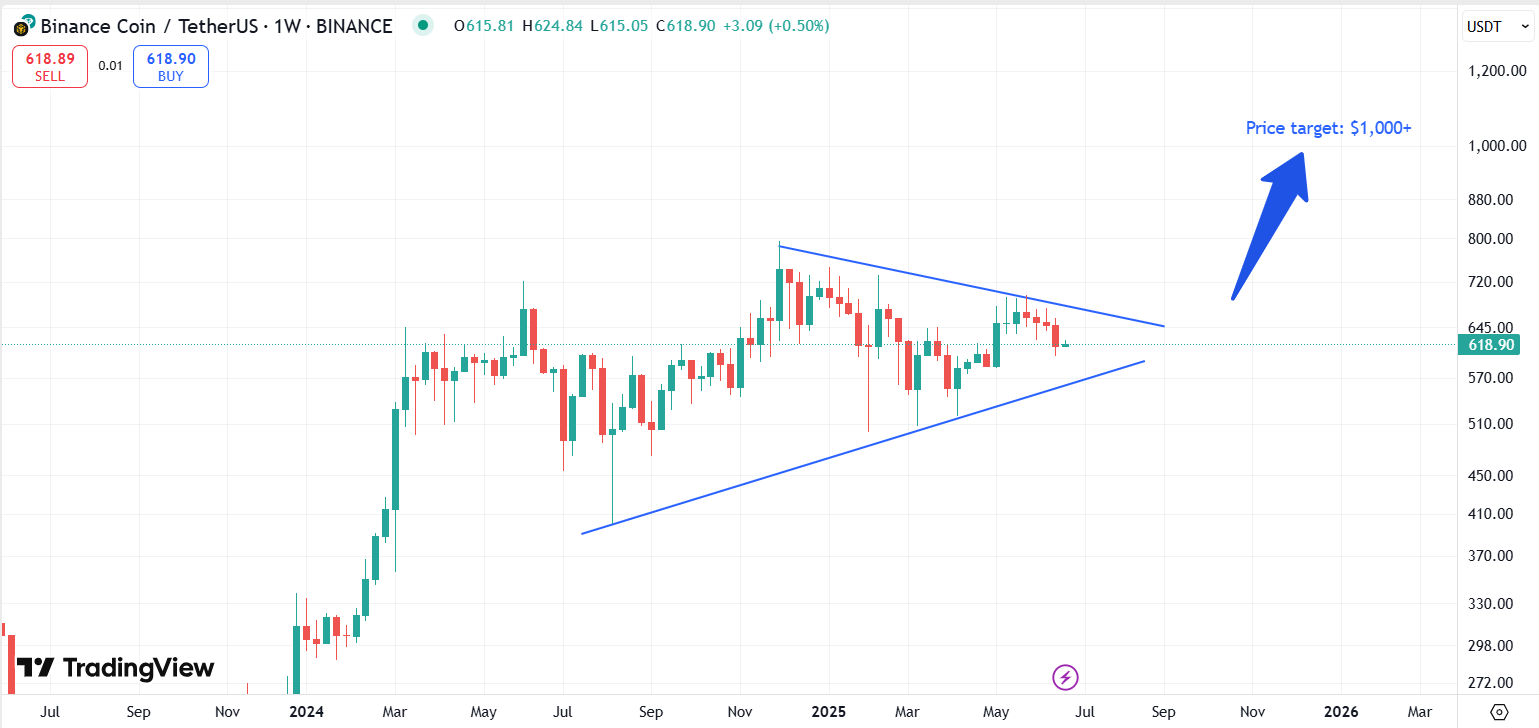

A bullish breakout above the upper resistance could push BNB to targets between $1,150 and $1,200, depending on the breakout level, suggesting a possible triple-digit upside from current prices.
BNB Price Trajectory on Daily Timeframe
Meanwhile, on the daily BNB price chart, the RSI currently hovers just below the neutral mark, signaling slight bearish momentum but not oversold territory.

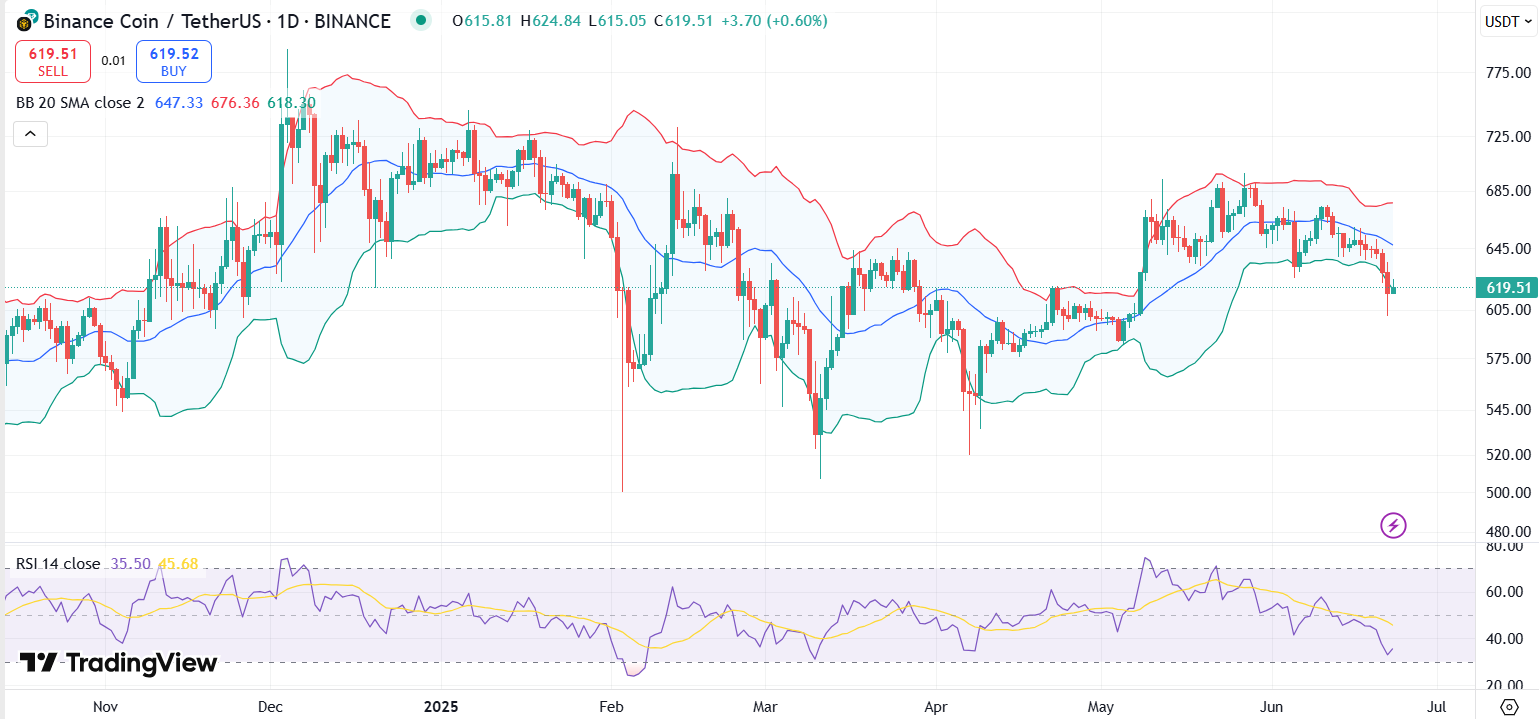
BNB daily chart with RSI and Bollinger Bands | Source: Trading View
The Bollinger Bands show price slipping below the midline (20-day SMA), which now acts as a resistance near $647.
This suggests potential short-term consolidation unless buyers step in. Traders should note that a price drop below the lower band around $605 could drag BNB toward $575.
Meanwhile, the MACD line remains below the signal line and both are in the negative zone, reflecting bearish momentum. A crossover would indicate a reversal, but for now, bears remain in charge. Immediate resistance levels are at $647 and $676.

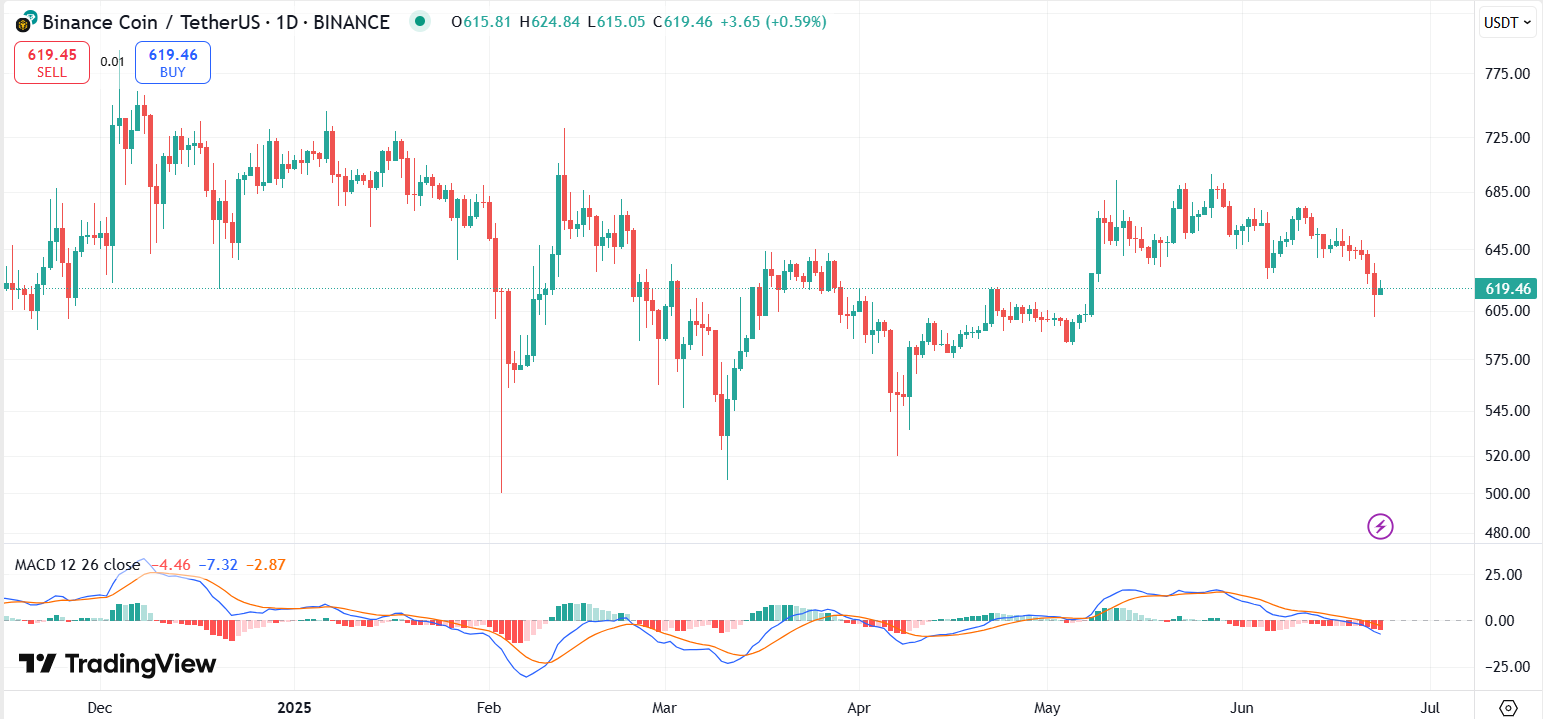
BNB daily chart with MACD | Source: Trading View