
Bitcoin ETFs recorded their second‑largest outflow in history, with $870 million exiting on a single day, driving BTC down to $96K.
On Thursday, the US spot Bitcoin ETFs clocked in $870 million in net outflows, the second‑largest daily outflow on record.
The sell‑off arrived during a pullback that pushed Bitcoin BTC $68 231 24h volatility: 2.3% Market cap: $1.37 T Vol. 24h: $56.09 B down to the $96,000 level, resulting in $1.10 billion in liquidations in the past 24 hours.
As per SoSoValue data, Ethereum ETFs weren’t spared either, recording $260 million in outflows, marking their third consecutive day in the red. However, Solana ETFs showed strength with $1.49 million in inflows.
On November 13 (ET), spot Bitcoin ETFs recorded total net outflows of $870 million, the second-largest in history. Spot Ethereum ETFs saw total net outflows of $260 million, marking the third consecutive day of outflows. U.S. spot Solana ETFs registered net inflows of $1.49… pic.twitter.com/e1F2R5GSat
— Wu Blockchain (@WuBlockchain) November 14, 2025
Short‑Term Traders Dominate Selling
On‑chain data from CryptoQuant shows a growing disconnect between short‑term and long‑term Bitcoin holders.
Binance data shows that short‑term selling pressure surged sharply, with the net selloff dominance climbing to 49.12K BTC, one of the highest readings in months.
The short-term holders alone contributed nearly 9.79K BTC to selling activity, while long-term traders sold almost nothing, just 0.19K BTC. The widening gap between the two groups paints a fragile picture for the market for the near future.

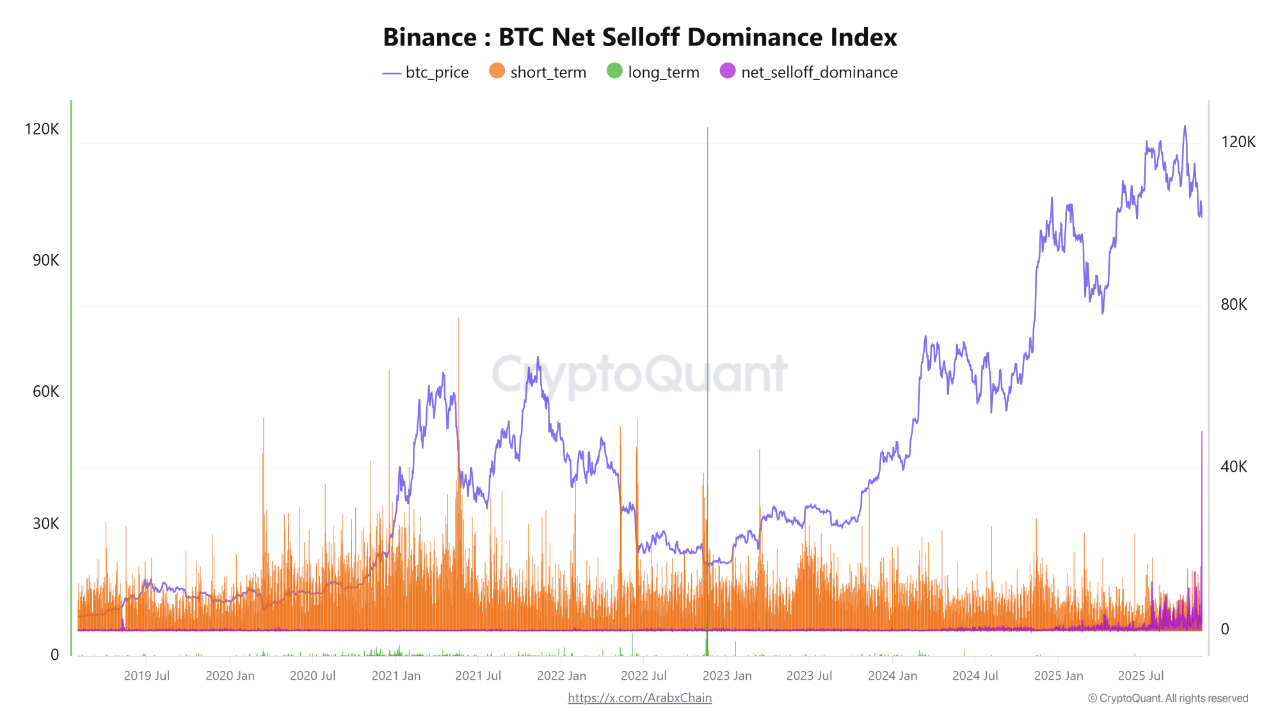
BTC net selloff dominance index, Binance. | Source: CryptoQuant
While short-term traders are reacting quickly to price dips, long-term holders remain unfazed. Historically, deeper pullbacks only manifest when long-term holders begin offloading, which is not happening yet.
CryptoQuant analysts revealed that the unforeseen dominance of short-term selling indicates that a severe pullback could follow if liquidity remains low and buyers fail to step in.
Price Drops While Volume Dries Up
CryptoQuant analysts also highlighted a divergence between prices and volume, with Bitcoin’s recent drop to around $97,450 clocking in a daily volume fall of just 11,877 BTC.
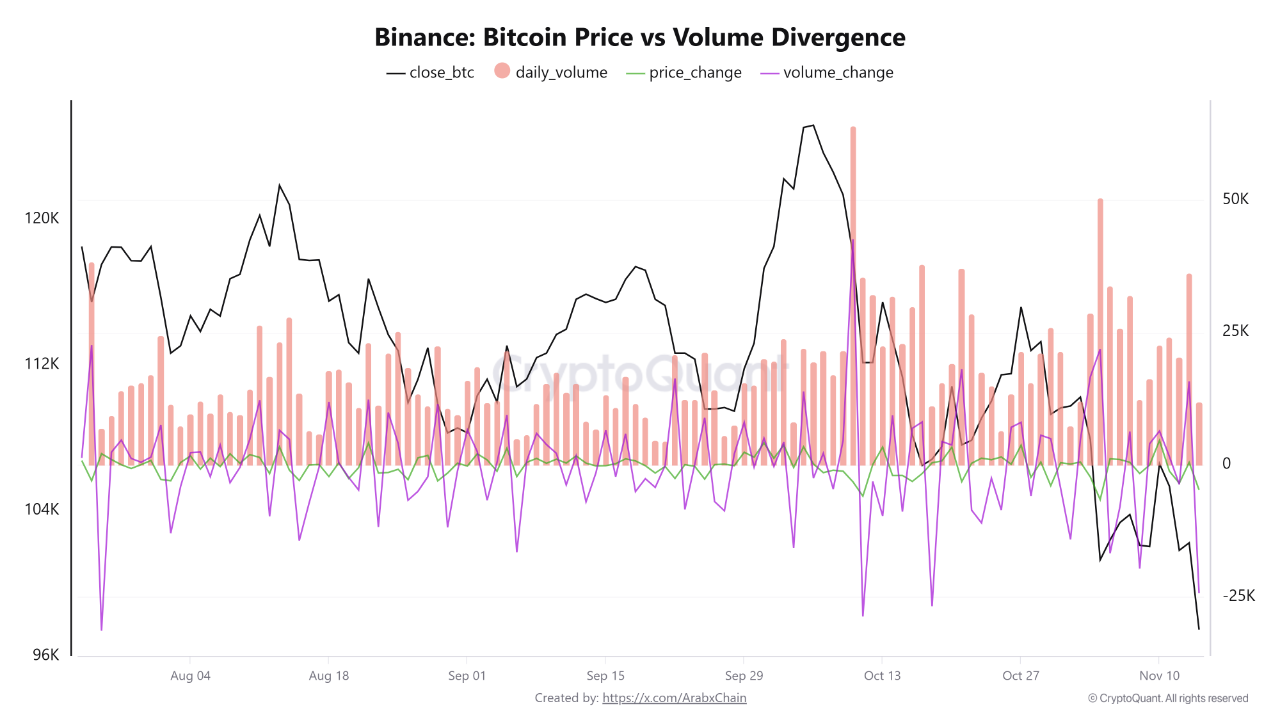
Bitcoin price vs volume divergence. | Source: CryptoQuant
The volume_change indicator dropped to -24,320 BTC. Meanwhile, the price_change indicator hit -4.76K, which means that prices are dropping without the participation of strong buying flows.
Capital Is Staying in the System
Swissblock reported a spike in stablecoin dominance as BTC broke below the important $100,000 mark. They claim that capital isn’t leaving crypto, it’s waiting. Funds are shifting into stablecoins, forming “dry powder” for future deployment.
Stablecoin dominance is surging as BTC breaks below $100K: capital is not leaving the system, it's waiting.
There is no panic rotation into Bitcoin yet.
Instead, buying power is parking in stables, a classic dry-powder accumulation.$BTC is defending $97K–$98.5K zone, but… pic.twitter.com/9IJms1McF5— Swissblock (@swissblock__) November 13, 2025
BTC is currently defending the $97K-$98.5K zone, but Swissblock said that a capitulation sweep toward roughly $95K or a reclaim and hold above $100K could make BTC the best cryptocurrency to buy in December.
next