
Should the bears break the demand zone of $0.042 with a daily bearish candle, closed below the zone, Cardano price may find its low at $0.032 – $0.021 price level.
Key Highlights:
- The bulls were in charge of the Cardano market;
- the coin was making higher highs on the medium-term;
- ADA price may resume its uptrend on the daily chart.
ADA/USD Price Long-term Trend: Bullish
Supply Zones: $0.050, $0.058, $0.068
Demand Zones: $0.042, $0.032, $0.021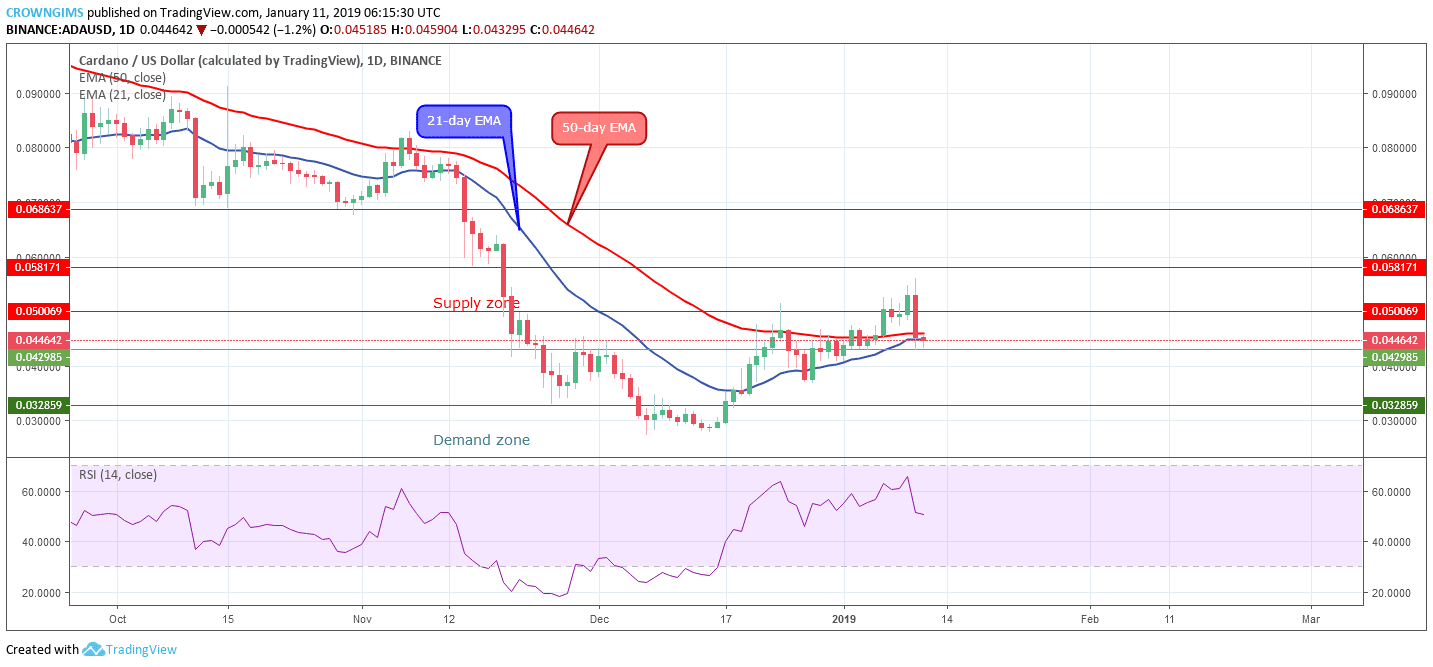

The 21-day EMA and the 50-day EMA are coming closer to each other as the ADA price is declining which may be a pullback. Cardano price is between the two EMAs. The Relative strength index period 14 is around 50 levels pointing down as the Sell signaling.
Should the bears break the demand zone of $0.042 with a daily bearish candle, closed below the zone, ADA price may find its low at $0.032 – $0.021 price level.
ADA/USD Price Medium-term Trend: Bullish
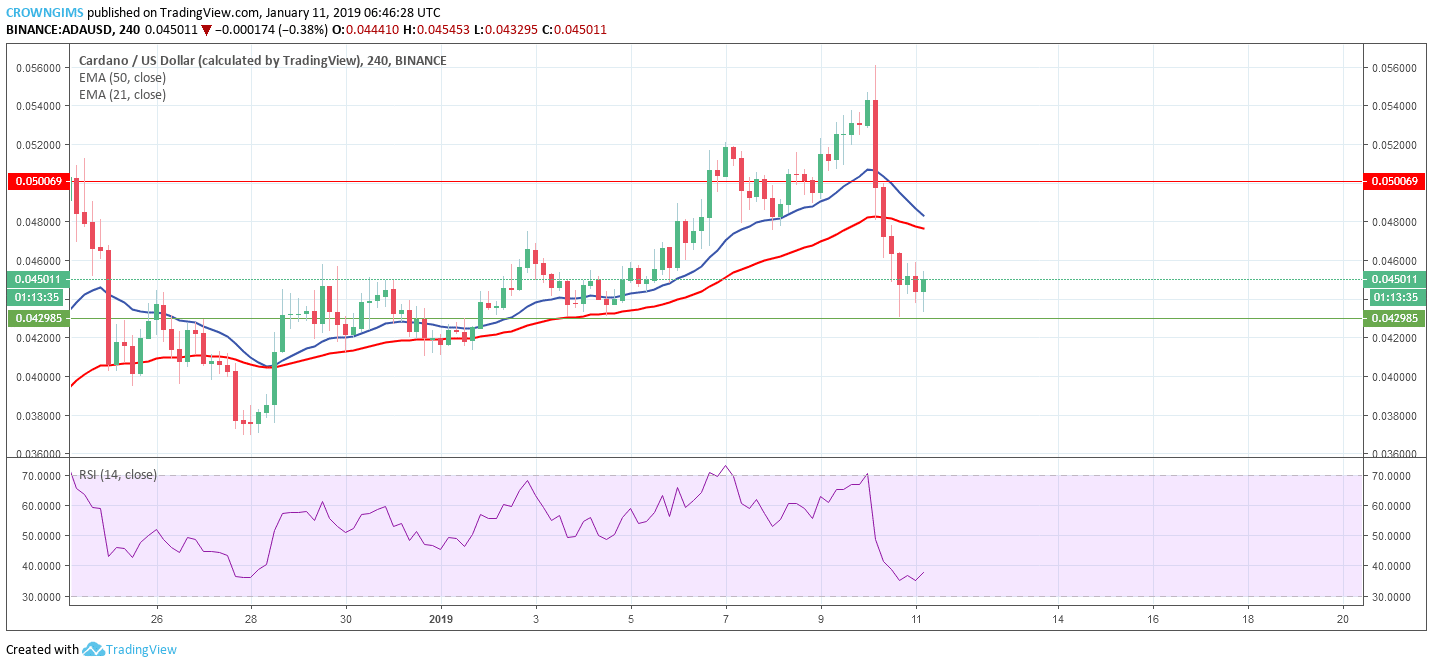
The current bearish trend could be price retracement before ADA resume its bullish movement as the Relative Strength Index is below 40 levels with the signal line point upward which indicates that the bulls are gradually returning to the ADA market.
next