Cardano Price Analysis: ADA/USD Trends of January 11–17, 2019
Should the bears break the demand zone of $0.042 with a daily bearish candle, closed below the zone, Cardano price may find its low at $0.032 – $0.021 price level.
By Azeez Mustapha
Updated
2 mins readPhoto: Shutterstock
the coin was making higher highs on the medium-term;
ADA price may resume its uptrend on the daily chart.
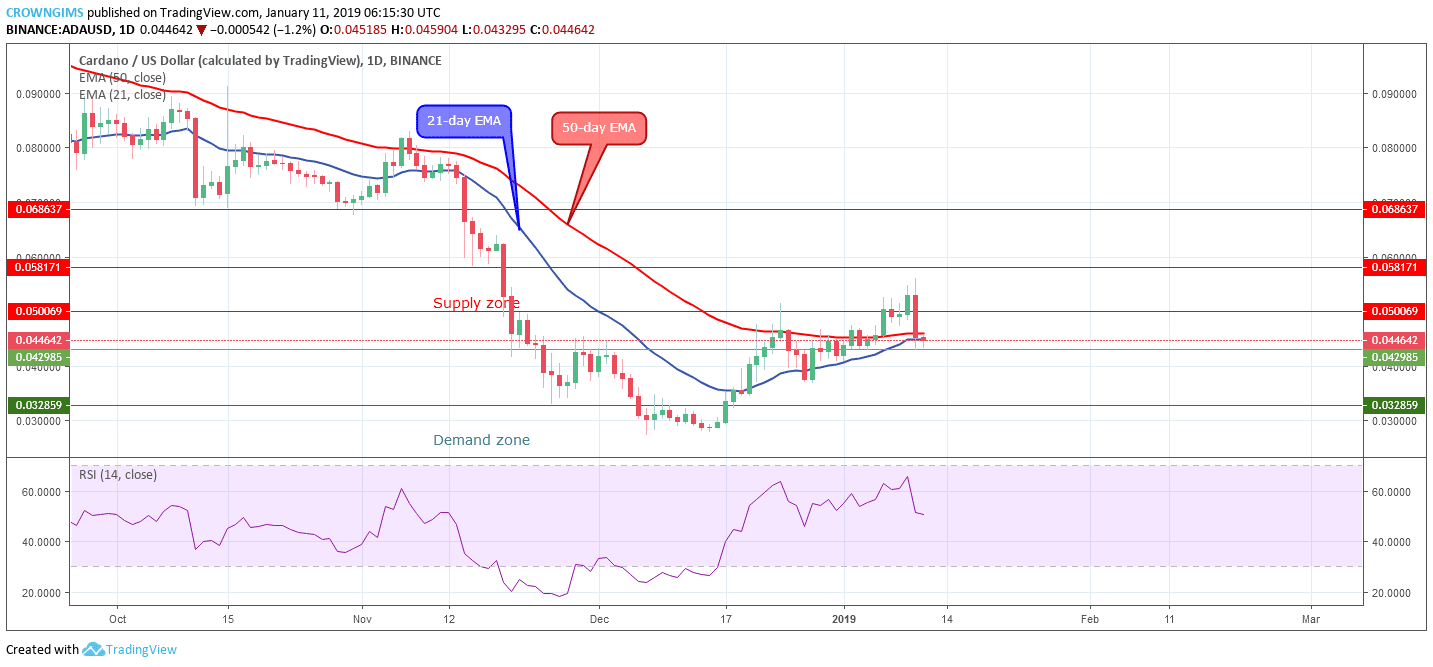
ADA/USD Price Long-term Trend: Bullish
Supply Zones: $0.050, $0.058, $0.068
Demand Zones: $0.042, $0.032, $0.021ADA is on the bullish trend on the long-term outlook. Cardano price started consolidating on December 29 up till January 5 at the $0.042 price level. The coin broke out of the ranging zone on January 06 as the bulls gained momentum, clearly seen on the daily chart with the emerging of big bullish candle that broke the supply zone of $0.050 and the ADA price moved towards $0.058. The bears opposed the continuation of Cardano price increment as the bearish engulfing candle formed which placed the ADA price on the demand zone of $0.042.
The 21-day EMA and the 50-day EMA are coming closer to each other as the ADA price is declining which may be a pullback. Cardano price is between the two EMAs. The Relative strength index period 14 is around 50 levels pointing down as the Sell signaling.
Should the bears break the demand zone of $0.042 with a daily bearish candle, closed below the zone, ADA price may find its low at $0.032 – $0.021 price level.
ADA/USD Price Medium-term Trend: Bullish
ADA/USD continues its bullish trend on the medium-term outlook. Recently, the coin has been making higher highs movement on the 4-Hour chart since December 28 after the bulls gained momentum and Cardano price rallied to the north broke up the $0.050 price level and extended towards $0.058 price level. The bearish engulfing candle formed signaled the higher pressure of the bears into the ADA market which pushed the cryptocurrency to $0.042 demand zone.
The current bearish trend could be price retracement before ADA resume its bullish movement as the Relative Strength Index is below 40 levels with the signal line point upward which indicates that the bulls are gradually returning to the ADA market.
Azeez Mustapha is a specialist in Computer Studies (including DTP), Forex and Crypto trading professional. Being expert technical and currency analyst, as well as experienced fund manager and author of several books, Azeez places strong focus on crypto market studies conducting comprehensive price analyses and sharing forecasts of presumptive market trends.

 ADA is on the bullish trend on the long-term outlook. Cardano price started consolidating on December 29 up till January 5 at the $0.042 price level. The coin broke out of the ranging zone on January 06 as the bulls gained momentum, clearly seen on the daily chart with the emerging of big bullish candle that broke the supply zone of $0.050 and the ADA price moved towards $0.058. The bears opposed the continuation of Cardano price increment as the bearish engulfing candle formed which placed the ADA price on the demand zone of $0.042.
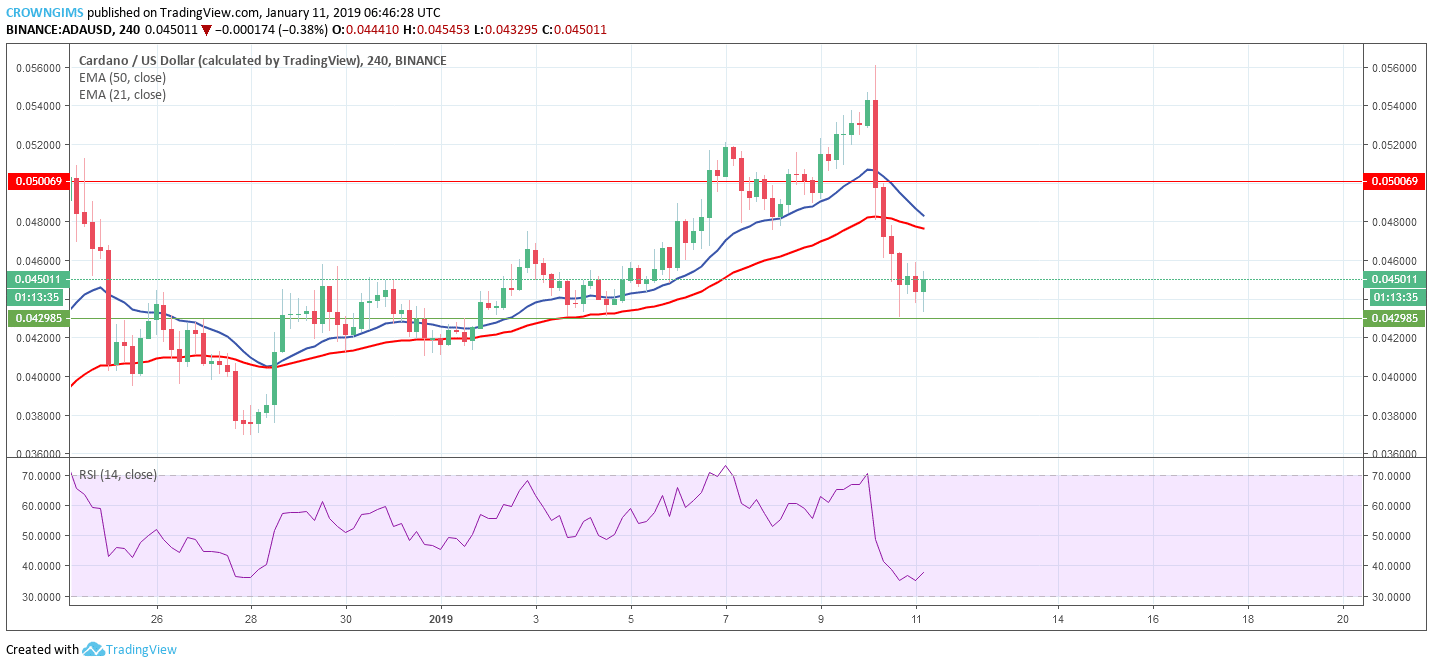 ADA/USD continues its bullish trend on the medium-term outlook. Recently, the coin has been making higher highs movement on the 4-Hour chart since December 28 after the bulls gained momentum and Cardano price rallied to the north broke up the $0.050 price level and extended towards $0.058 price level. The bearish engulfing candle formed signaled the higher pressure of the bears into the ADA market which pushed the cryptocurrency to $0.042 demand zone.