
With ADA struggling to hold ground, LINK’s mix of security recognition, institutional partnerships, and bullish momentum could propel it past Cardano.
Chainlink LINK $8.58 24h volatility: 1.3% Market cap: $6.24 B Vol. 24h: $143.68 M has achieved a major milestone, becoming the first oracle and interoperability platform to receive ISO 27001 certification and a SOC 2 Type 1 attestation.
These certifications, verified by Deloitte & Touche LLP, cover Chainlink’s Price Feeds, SmartData (Proof of Reserve, Net Asset Value), and its Cross-Chain Interoperability Protocol (CCIP).
Chainlink’s Growing Institutional Stronghold
Chainlink currently manages over $90 billion in on-chain value, powering protocols like Aave, GMX, Pendle, Compound, and Ether.fi, according to a blog post.
Meanwhile, its CCIP standard has been adopted by traditional giants such as Swift, UBS, ANZ Bank, and SBI Digital Markets, bridging the gap between DeFi and traditional finance.
Unlike other blockchain networks that focus narrowly on smart contracts or layer-1 ecosystems, Chainlink seeks to become an all-in-one oracle platform, addressing data, interoperability, compliance, privacy, compute, and legacy integration.
ADA vs. LINK: Race for the Top 10
While Cardano ADA $0.24 24h volatility: 1.6% Market cap: $8.97 B Vol. 24h: $248.88 M currently sits at rank 10 with a market cap of $30.89 billion and trades at $0.8657 (+1% in 24h), it has been under pressure, dropping 10.4% over the past week.
On the other hand, LINK trades at $26.11 (+4% in 24h, +12% in 7d), holding a market cap of $17.7B and ranked 11, just below ADA.
If LINK maintains this momentum, the flipping of ADA could soon be on the horizon, making it a top crypto to buy in 2025.
LINK Price Analysis: $28 Resistance in Sight
The daily LINK/USDT chart shows LINK trading within a strong ascending channel, currently consolidating around $26 after a sharp rally.
The immediate resistance lies near $28–29, a historically strong supply zone marked on the chart. A breakout above this level could propel LINK toward the $32–35 range.

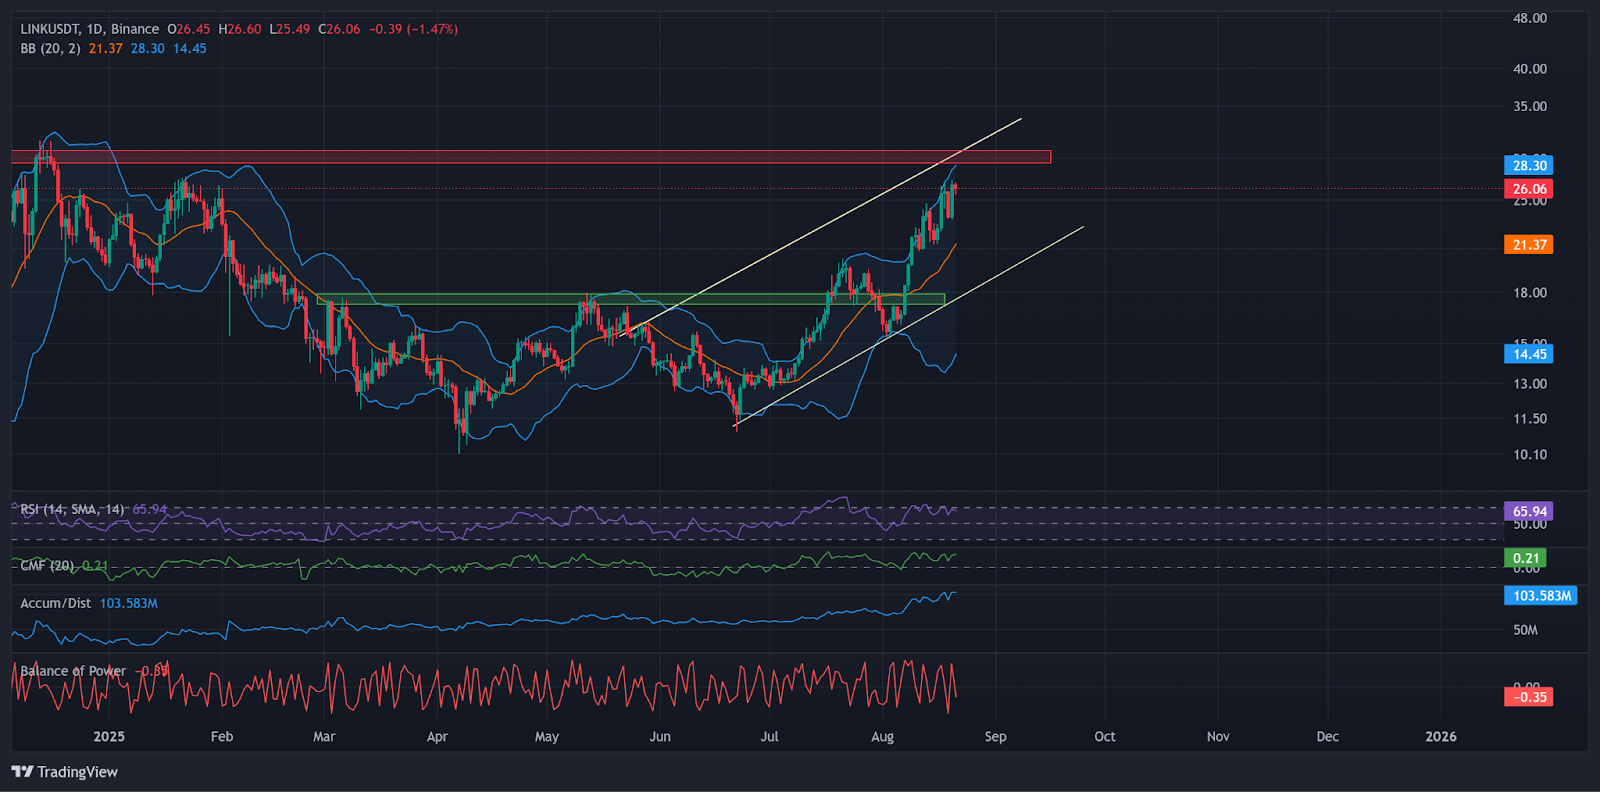
LINK’s price action 1D Chart with momentum indicators. | Source: TradingView
Meanwhile, the support sits at $21.5–22, coinciding with the mid-Bollinger Band and a prior breakout zone. Losing this level may send LINK back to the $18–19 range, where it last consolidated.
The RSI at 65.9 suggests LINK is nearing overbought territory but still has room for upside. Positive readings on the Chaikin Money Flow (CMF) and Accumulation/Distribution indicators highlight strong buying pressure.
In short, LINK is positioned for a potential breakout if bulls can sustain momentum above $28, possibly setting up a challenge to ADA’s top-10 dominance in the coming weeks.
next