
For the twelfth week in a row, digital asset investment products have drawn over $1 billion in inflows, signaling sustained investor appetite.
For the twelfth straight week, digital asset investment products have recorded inflows topping $1 billion, continuing a remarkable streak of investor confidence in the crypto market.
Last week alone, $1.04 billion poured into digital assets, driven primarily by US investors, according to the latest CoinShares report.
The cumulative inflow over this streak now totals a staggering $18 billion, pushing total assets under management (AuM) to a record $188 billion.
Geographically, the United States remains the engine of crypto capital, contributing $1 billion in inflows last week alone.
Germany ($38.5 million) and Switzerland ($33.7 million) showed moderate bullishness, while Canada (-$29.3 million) and Brazil (-$9.7 million) saw outflows.
Ethereum Outpaces Bitcoin
While Bitcoin BTC $70 741 24h volatility: 2.8% Market cap: $1.41 T Vol. 24h: $48.91 B continues to dominate in absolute numbers, with $790 million in inflows this week alone, Ethereum ETH $2 075 24h volatility: 3.3% Market cap: $250.42 B Vol. 24h: $20.81 B is quietly outperforming it in terms of relative growth.
Over the past 11 weeks, Ethereum’s average weekly inflow has been 1.6% of its AuM, double that of Bitcoin’s 0.8%. Last week, Ethereum added $226 million, marking its eleventh consecutive week of positive flows.

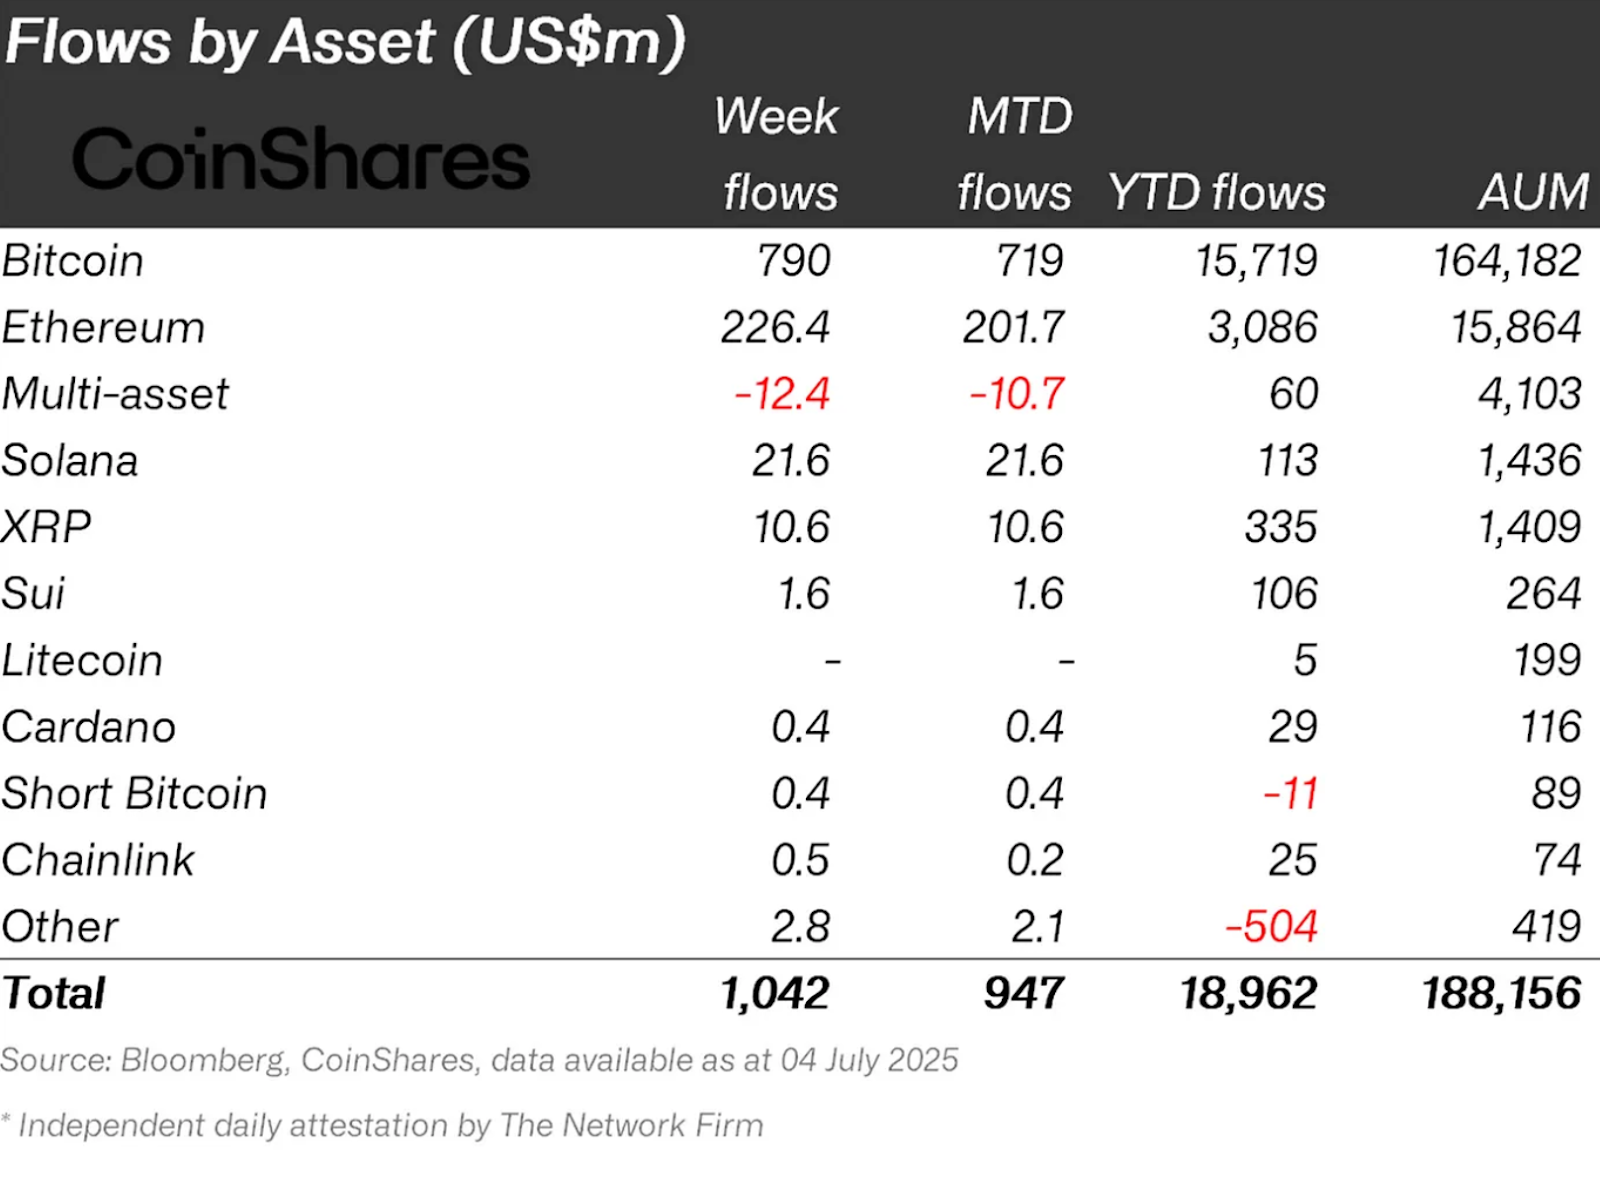
Flows by Crypto Asset | Source: CoinShares
While Bitcoin’s inflows have slowed from the $1.5 billion weekly average seen in the previous three weeks, perhaps due to its price hovering near all-time highs, ETH appears to be gaining favor among institutional and retail investors alike.
Macro Outlook: TOTAL3 Analysis
The Total Crypto Market Cap excluding Bitcoin and Ethereum (TOTAL3) weekly chart paints a cautiously optimistic picture. At the time of writing, TOTAL3 is hovering near $845 billion, above key support zones.
The Relative Strength Index (RSI) sits around 50.7, signaling a neutral stance after bouncing from sub-40 levels in recent weeks.
Meanwhile, the MACD histogram shows a negative reading, but the gap between the MACD line and the signal line is narrowing, often seen just before a potential bullish crossover, which would confirm a reversal of recent downside pressure.

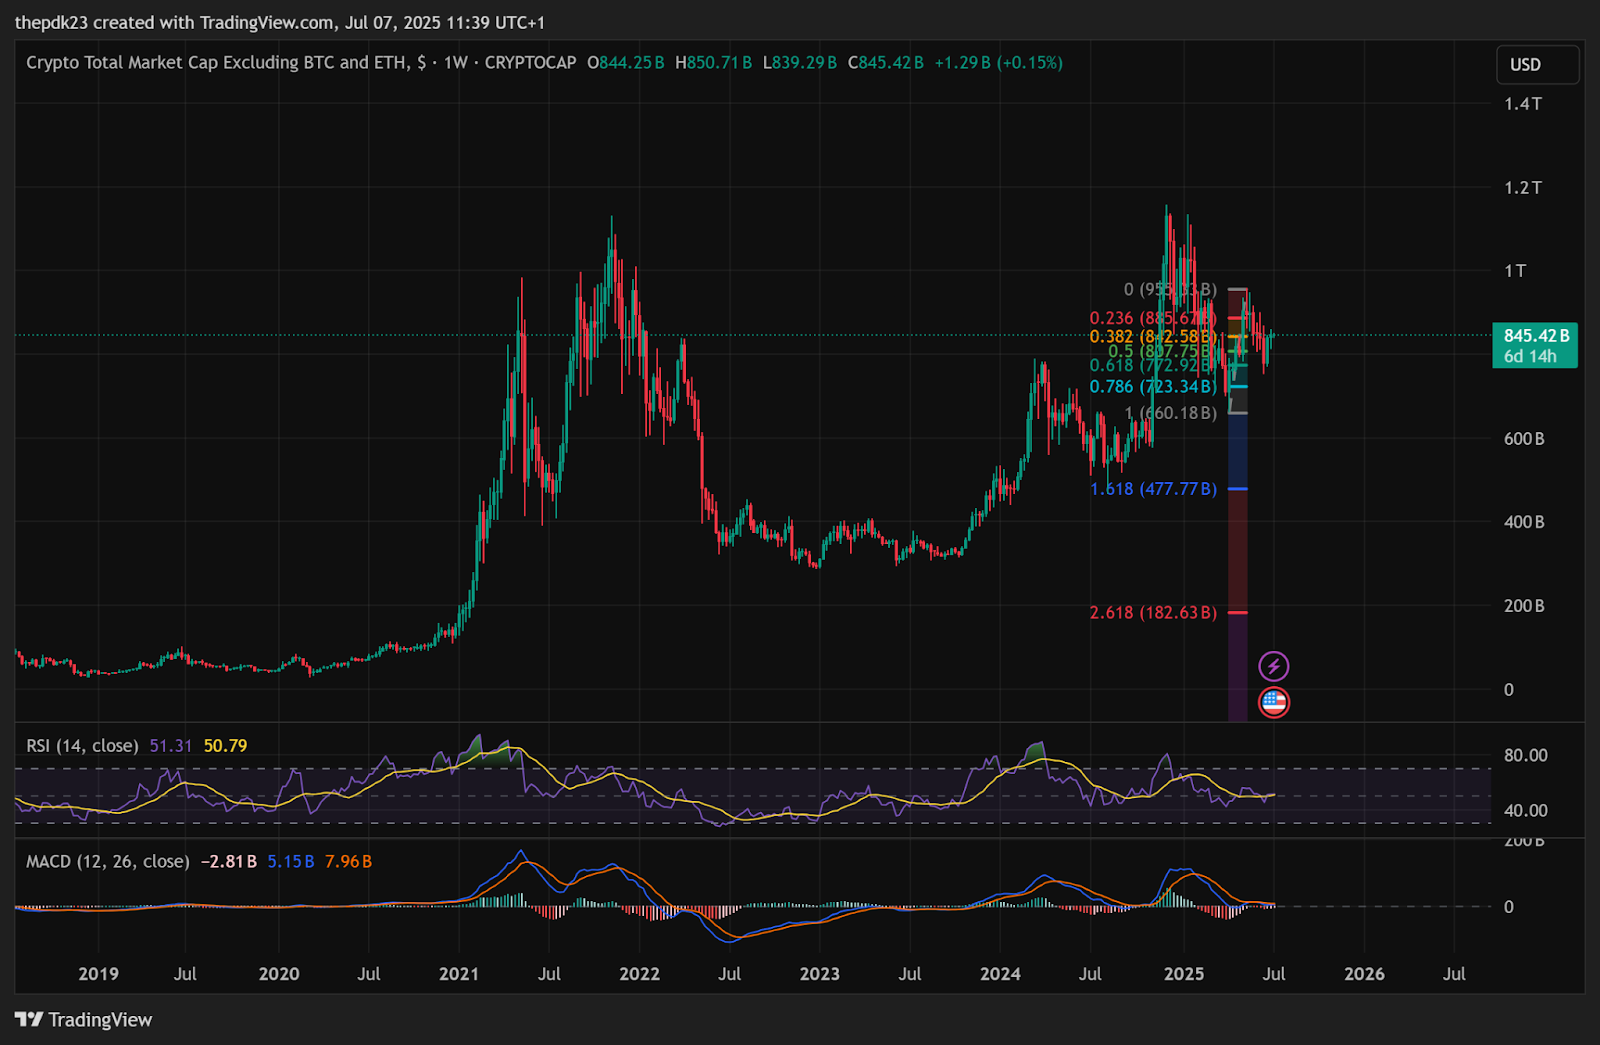
TOTAL3 Weekly Chart with RSI, MACD | Source: TradingView
A key Fibonacci retracement from the swing high near $958 billion down to the recent swing low around $660 billion in the chart above reveals a critical resistance level at 0.236 Fib ($880 billion).
Meanwhile, the 0.382 Fib around $825 billion has held as short-term support while the 0.618 Fib near $922 billion acts as the next major upside target. If bulls can reclaim the 0.236 level, the next target is at 0.618 ($922 billion) and possibly even a retest of $958 billion is likely.
However, a breakdown below $825 billion could push the market toward the 0.786 Fib ($793 billion), with deeper support at the 1.0 Fib retracement ($660 billion).
The TOTAL3 chart confirms consolidation among altcoins rather than collapse. If Ethereum and other altcoins continue to show strength relative to BTC, we may witness a classic altseason rotation in the coming weeks.
next