
Ethereum ETFs recorded their first outflow in over a week as ETH slipped below $4,400, breaking its winning streak.
Spot Ethereum ETFs ended their eight-day streak of net inflows on Oct. 9, recording an $8.54 million outflow as Ether ETH $2 215 24h volatility: 1.2% Market cap: $267.39 B Vol. 24h: $13.76 B slipped to around $4,357.
The asset fell nearly 2% in 24 hours and about 3% over the past week, even as trading volume rose 15%, according to the data from CoinMarketCap.
Meanwhile, Bitcoin ETFs extended their winning run with $198 million in net inflows, marking their ninth consecutive day of gains.
On October 9 (ET), spot Bitcoin ETFs recorded a total net inflow of $198 million, marking the ninth consecutive day of net inflows. In contrast, spot Ethereum ETFs saw a total net outflow of $8.54 million, ending an eight-day streak of net inflows.https://t.co/Hj2Gs49bWa pic.twitter.com/MIQZf6Q0NE
— Wu Blockchain (@WuBlockchain) October 10, 2025
The contrast highlights shifting investor sentiment, with capital now rotating from ETH into BTC BTC $71 632 24h volatility: 1.7% Market cap: $1.43 T Vol. 24h: $27.76 B . Increasing Bitcoin dominance would eventually delay a potential altcoin season.
Staking Additions to ETFs
Meanwhile, 21Shares updated its Ethereum ETF (TETH) by adding staking and waiving its 0.21% sponsor fee for twelve months beginning October 9. The move follows Grayscale’s earlier decision to integrate staking into its US-based Ethereum ETF.
Industry observers view these developments as a natural progression for crypto ETFs, aiming to make them more appealing to institutional and retail investors seeking additional returns from staking rewards.
ETH Price Analysis: Resistance Looms Near ATHs
Ethereum remains in a long-term bullish structure, trading within an ascending channel supported by a trendline extending from its 2022 lows.
The weekly ETH/USD chart shows the asset hovering near a key resistance zone just below $5,000, a level that has historically served as a supply area where sellers step in.
On the other hand, the MACD continues to reflect bullish momentum, while the Chaikin Money Flow stays in positive territory, suggesting sustained accumulation. However, the current rejection near $4,800–$5,000 hints that buyers may be losing short-term strength.

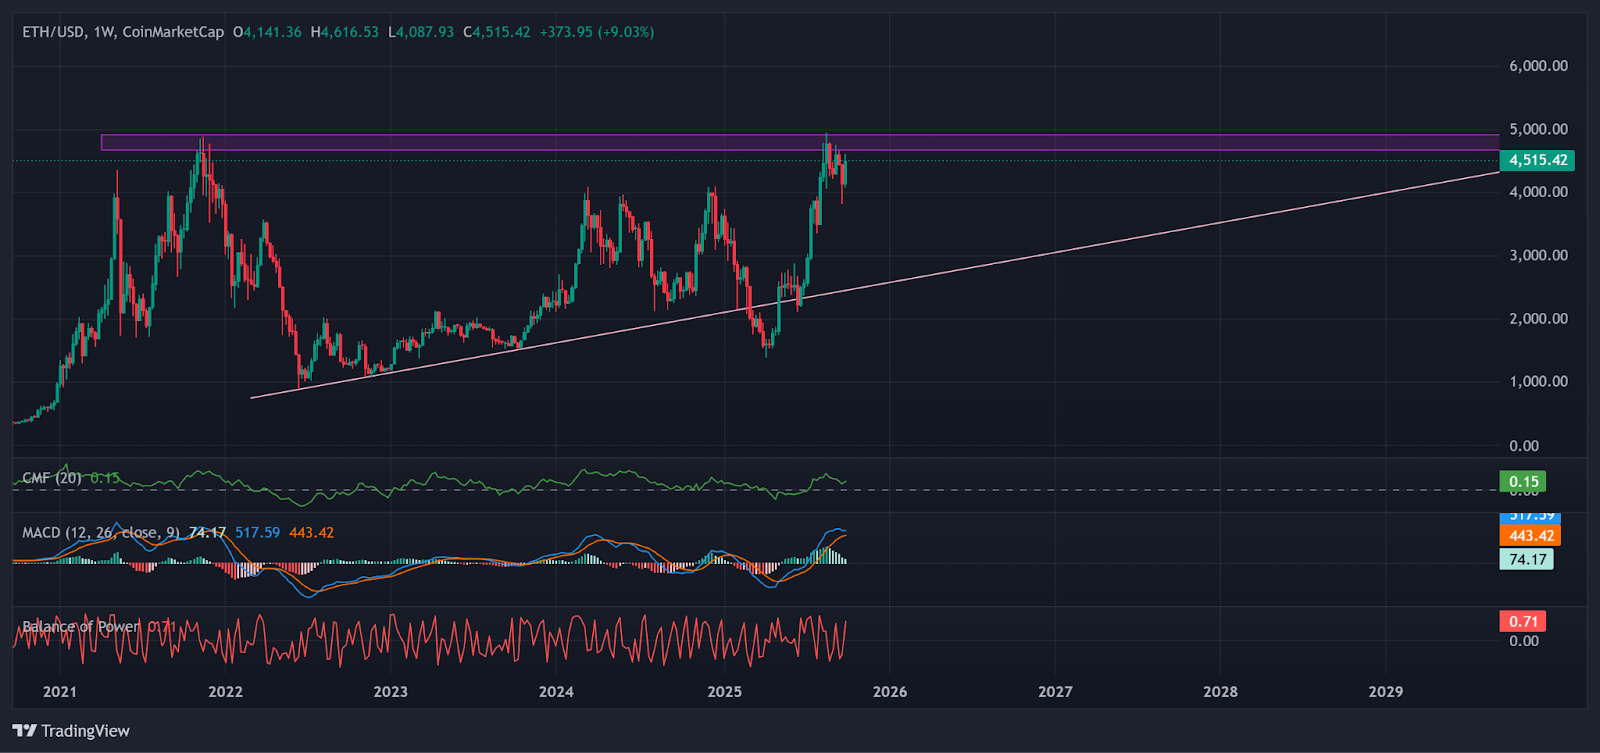
ETH price action inside bullish structure | Source: TradingView
A breakout above this range, supported by volume, would confirm a continuation toward new highs, while failure to do so could lead to a pullback toward the ascending trendline around $4,000.
Analyst Weighs In
Crypto analyst Ali Martinez claimed once again that the $4,000–$4,800 range for Ethereum is a “danger zone.” In his chart, Martinez shared multiple instances, marked by black arrows, where Ethereum has faced sharp rejections in this very zone.
I wasn't lying when I told you $4,000–$4,800 is a danger zone for Ethereum $ETH! https://t.co/KlHhiUGo91 pic.twitter.com/SlR9lV7HAY
— Ali (@ali_charts) October 10, 2025
In each case, Ethereum’s rallies into this range were met with substantial sell pressure, leading to considerable corrections, some exceeding 30–60%.
These repeated failures, the most recent one being a pull back to $4,336, shows how sharply upward momentum has often fizzled within this “danger zone.”
next