
Ethereum starts the week with a solid recovery and fresh optimism as Vitalik proposes a gas cap and whale activity hints at a $3,500 price target.
Ethereum ETH $1 957 24h volatility: 7.4% Market cap: $236.15 B Vol. 24h: $22.69 B has started the week on a strong note, bouncing back from its weekend dip and briefly crossing $2,600 earlier on Monday. At the time of writing, ETH is trading around $2,585, up by 2.8% in the last 24 hours.
ETH’s 24-hour trading volume has surged by 70% to $15.14 billion, reflecting renewed interest in the market.
The rise comes amid ecosystem optimism as Ethereum co-founder Vitalik Buterin announced a new proposal, EIP-7983, during the Ethereum Community Conference.
The proposal would enforce a protocol-level gas cap on individual transactions. It aims to enhance Ethereum’s long-term stability, security, and compatibility with emerging technologies.
Vitalik explained that Ethereum and the crypto space need “practical, user-centered safeguards” as they move toward mass adoption.
A protocol-level gas cap would protect users from spikes in transaction fees while ensuring Ethereum remains accessible and decentralized.
Whale Movements Signal Confidence
On-chain data from The Data Nerd shows that whale address 0x1fc withdrew 1,900 ETH, worth around $4.86 million, from Binance to stake.
2 hours ago, a whale 0x1fc withdrew 1,900 $ETH (~$4.86M) from #Binance and staked them all
Just now, he hodls totally 6,989 $ETH at avg entry ~$2,507.
Address:https://t.co/eGTBWRX43L pic.twitter.com/g5S8KnMSEh
— The Data Nerd (@OnchainDataNerd) July 7, 2025
The exchange exit move suggests a notable accumulation trend, indicating whales are preparing for a bullish leg. Interestingly, the whale currently holds a total of 6,989 ETH at an average entry of around $2,507.
Ether price has been following a Wyckoff accumulation pattern since early June, with a local top near $2,900 and a capitulation below $2,100.
Popular crypto analyst Cas Abbe noted that if ETH manages a daily close above $2,800, it could reach $3,500 within weeks.
$ETH is perfectly following its Wyckoff accumulation pattern.
A local top at $2.9K happened exactly along with a capitulation below $2,100.
Now, ETH is moving up again and the short-term target is $2,800.
If ETH manages a daily close above $2.8K, $3.5K ETH will happen within a… pic.twitter.com/4SprYqmrij
— Cas Abbé (@cas_abbe) July 6, 2025
ETH Price to Surge?
On the daily ETH price chart, the RSI is suggesting neutral-to-bullish momentum with room to move before hitting overbought levels.

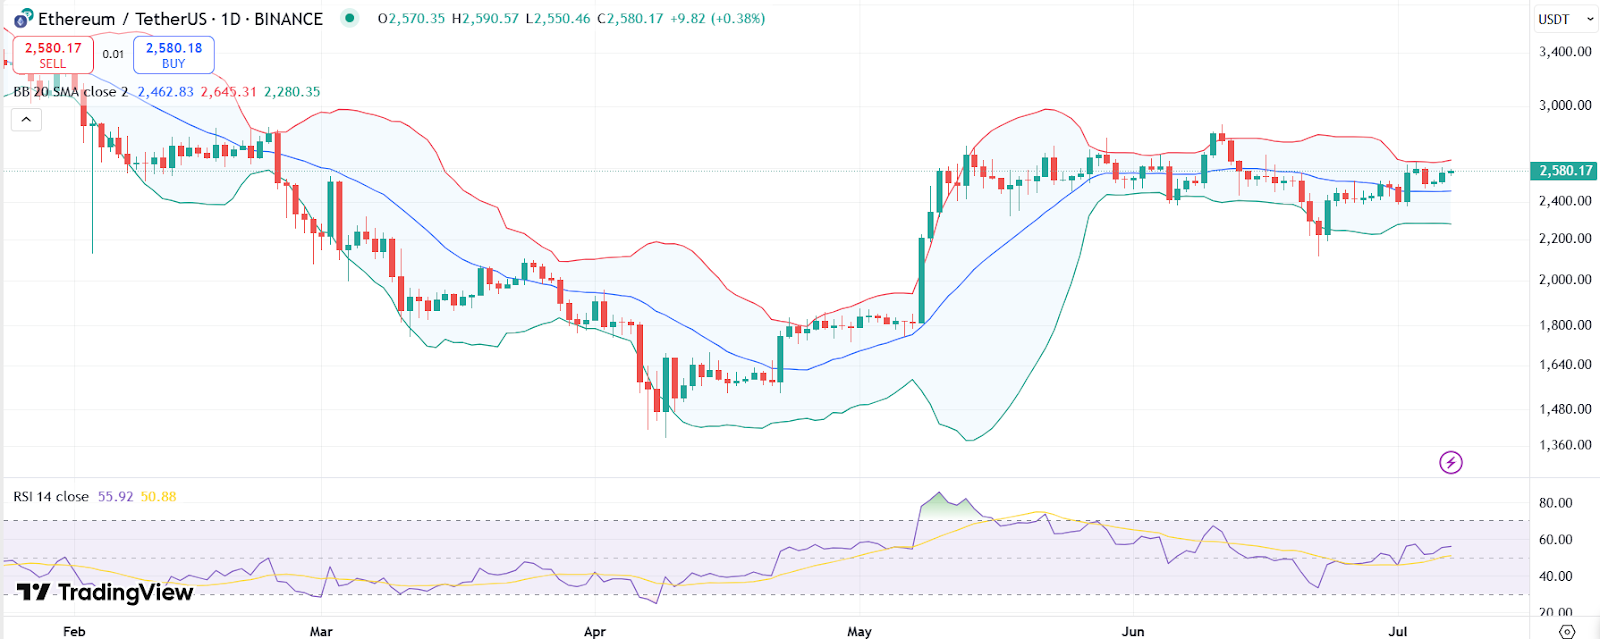
ETH price chart with RSI and Bollinger Bands | Source: Trading View
Bollinger Bands are tightening near $2,580, hinting at an impending breakout. The upper band around $2,645 acts as a resistance with a near-term target of $2,900–$3,000. However, traders should eye the lower band, with $2,300 support acting as a strong buy zone.
Meanwhile, the MACD shows a fresh bullish crossover, with the MACD line moving above the signal line. Though flat, the green histograms suggest growing market growth.

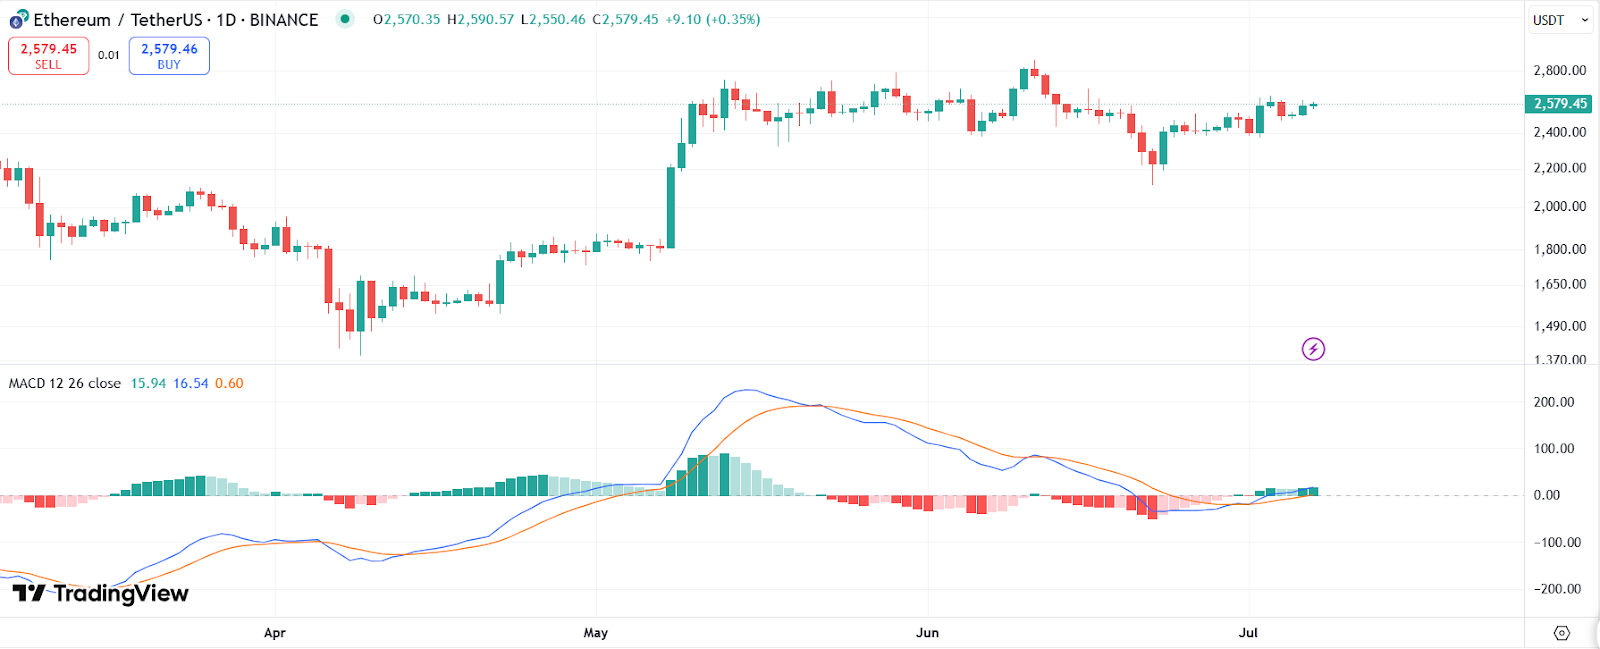
ETH price chart with MACD | Source: Trading View