
Ethereum continues to underperform but the rising bearish sentiment could signal a bullish rally for the cryptocurrency, according to Santiment.
Ethereum ETH $2 050 24h volatility: 0.8% Market cap: $246.83 B Vol. 24h: $21.41 B has recently been facing a challenging time, losing $62 billion in market cap over just 15 days. The ETH/BTC ratio has dropped 77% since December 2021, signaling a severely poor performance against Bitcoin BTC $70 159 24h volatility: 0.0% Market cap: $1.40 T Vol. 24h: $51.63 B .
Despite this, many analysts argue that this very pessimism might be the start of a major reversal.
According to market intelligence platform Santiment, Ethereum’s growing bearishness among investors could result in a bullish outlook for the cryptocurrency. It explained that markets generally tend to move in the opposite direction of public sentiment.
📊 Ethereum has been the source of humor for many top cap crypto traders, with the $ETH / $BTC ratio now down a massive -77% since December, 2021. But should its long-term slump make it an automatic write-off by now? Absolutely not. Read our deep dive. 👇https://t.co/JoK5GnI7Dm
— Santiment (@santimentfeed) April 11, 2025
Santiment also laid out the multi-pronged reasons behind Ethereum’s sluggish run: competition from fast-rising Layer-2 solutions, developer delays, high transaction costs, inconsistent narratives around its use case, and intense regulatory scrutiny.
Notably, Standard Chartered recently suggested that XRP XRP $1.39 24h volatility: 0.2% Market cap: $85.07 B Vol. 24h: $3.12 B could surpass Ethereum in market cap by the end of the year — a claim that would have seemed unthinkable just a year ago.
On top of that, large-scale token sell-offs by long-time holders have added constant pressure to ETH’s price. As per the data by LookOnChain, an “Ethereum OG” recently sold nearly 8,000 ETH (worth $11.8 million) after being inactive for three years.
Another #Ethereum OG starts dumping $ETH after 3 years of dormancy!
He has sold 7,974 $ETH($11.8M) at $1,479 over the past 2 hours and still holds 30,606 $ETH ($45.7M).https://t.co/Le4ViWn6OW pic.twitter.com/WtRwPHQfqu
— Lookonchain (@lookonchain) April 10, 2025
Ethereum (ETH) Price Outlook
At the time of writing, Ether is trading around $1,549, down roughly 4% in the past 24 hours. Just days ago, it touched a two-year low of $1,385.
On the daily ETH price chart, the RSI sits near 36, indicating oversold conditions. This indicates that traders could see a possible bounce in the near-term.

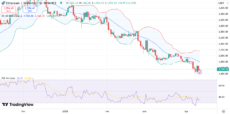
Ethereum price RSI, Bollinger Bands indicators | Source: Trading View
Bollinger Bands show price sitting near the lower band, suggesting an opportunity for mean reversion. If the price manages to surge and break above the middle band (20-day SMA) around $1,800, ETH could confirm a potential trend reversal.
However, the MACD remains in bearish territory, with the signal line above the MACD line and red bars extending on the histogram. Buyers have stepped in near $14,50 in April, making it a key short-term support level.

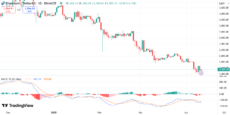
Ethereum price MACD indicator | Source: Trading View
Crypto analyst Ali Martinez also pointed out that ETH is approaching a historic support zone that has previously marked cycle bottoms.
#Ethereum $ETH is nearing a critical zone that has historically marked market bottoms and offered strong buying opportunities. pic.twitter.com/gZ4Tjrtqp0
— Ali (@ali_charts) April 10, 2025
According to Martinez, this could be a major buying opportunity for investors. If Ethereum holds its current levels, a relief rally could emerge.
next