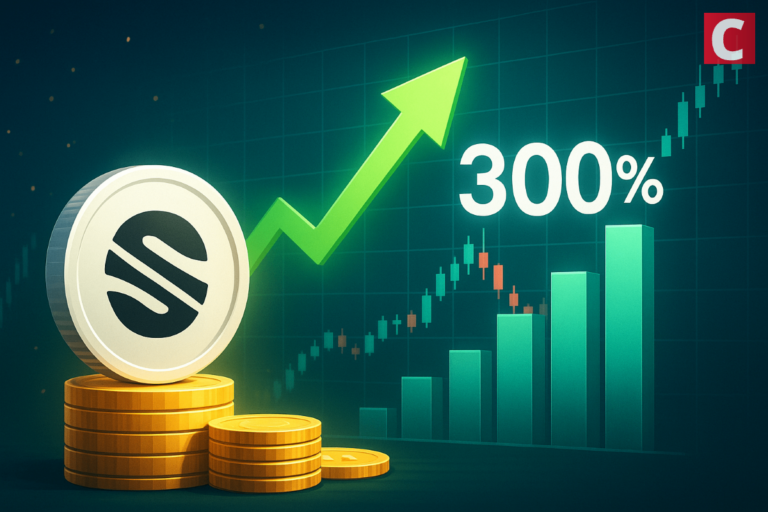
Sei Network is rapidly cementing its position as a rising star in the blockchain space, boasting a 368% surge in transaction fees and record-breaking TVL.
Sei Network SEI $0.0706 24h volatility: 0.0% Market cap: $475.75 M Vol. 24h: $50.22 M is on a tear, with explosive growth across multiple metrics.
According to data from Nansen, Sei posted a staggering +368% growth in transaction fees over the past 30 days, leading all chains by a wide margin.
The top 5 chains that had the highest fee growth in June
Positive fee chg % over the past 30d:@SeiNetwork +368%@unichain +57%@avax +44%@Aptos +27%@GravityChain +24% pic.twitter.com/kYICIoCAwh
— Nansen 🧭 (@nansen_ai) July 3, 2025
Sei generates promising numbers
The surge outpaced strong contenders like Unichain (+57%) UNI $3.84 24h volatility: 0.9% Market cap: $2.44 B Vol. 24h: $499.12 M , Avalanche (+44%) AVAX $9.32 24h volatility: 1.7% Market cap: $4.03 B Vol. 24h: $563.26 M , Aptos (+27%) APT $0.96 24h volatility: 4.0% Market cap: $753.17 M Vol. 24h: $273.96 M , and Gravity Chain (+24%), cementing Sei’s position as the fastest-growing L1 in terms of economic activity.
On the other hand, Sei’s Total Value Locked (TVL) has hit an all-time high of $612.11 million, boosted by a nearly 2% gain in the past 24 hours, according to DefiLlama.
The rising TVL reflects a broader institutional interest in high-performance infrastructure chains, especially as the Real World Asset (RWA) narrative gains steam.
Sei Network noted in a post on X that the RWA sector has surged by approximately 260% in the first half of 2025, ballooning from $8.6 billion to over $23 billion in value.
According to @redstone_defi, the RWA market has surged ~260% in the first half of 2025, growing from $8.6 billion to over $23 billion in value.
With high-performance rails designed for institutional adoption, Sei is positioned to become key infrastructure for RWA markets.… pic.twitter.com/drelcwQsFR
— Sei (@SeiNetwork) July 2, 2025
With infrastructure tailored for high-performance and institutional-grade deployment, “Sei is positioned to become key infrastructure for RWA markets.”
Weekly chart: analyst spots ih&s breakout
Market analyst Alex Clay shared a bullish outlook on SEI’s weekly chart. He identified a clean breakout from an inverse Head and Shoulders (iH&S) pattern, a classic bottoming structure often signaling trend reversal.
Awesome structure on Weekly Timeframe:fire:
Breakout of iH&S formation and now breaking through the Key Zone (orange) + SuperGuppy resistance confluence:eyes:
Looking for a rally in mid-term:chart_with_upwards_trend:
:dart:1 Target: 0.4895$
:dart:2 Target: 0.6720$
:dart:3 Target: 0.8900$ pic.twitter.com/lm8RjNucGN— Alex Clay (@cryptclay) July 2, 2025
SEI is now punching through a major resistance zone highlighted in orange, which also overlaps with the SuperGuppy resistance, adding further weight to the bullish momentum.
The breakout has flipped a crucial confluence zone into support. As long as the price holds above this level, the path appears open for a sustained rally.
Clay mapped out three medium-term price targets at $0.4895, $0.6720, and $0.8900, each corresponding to historical resistance and Fibonacci extensions.
Daily chart analysis: indicators support the bullish case
On the daily timeframe, the Relative Strength Index (RSI) is hovering at 62.67, suggesting strong upward momentum while still leaving room before entering overbought territory.
Also, the MACD line is above the signal line, and the histogram shows a growing spread in the positive zone.

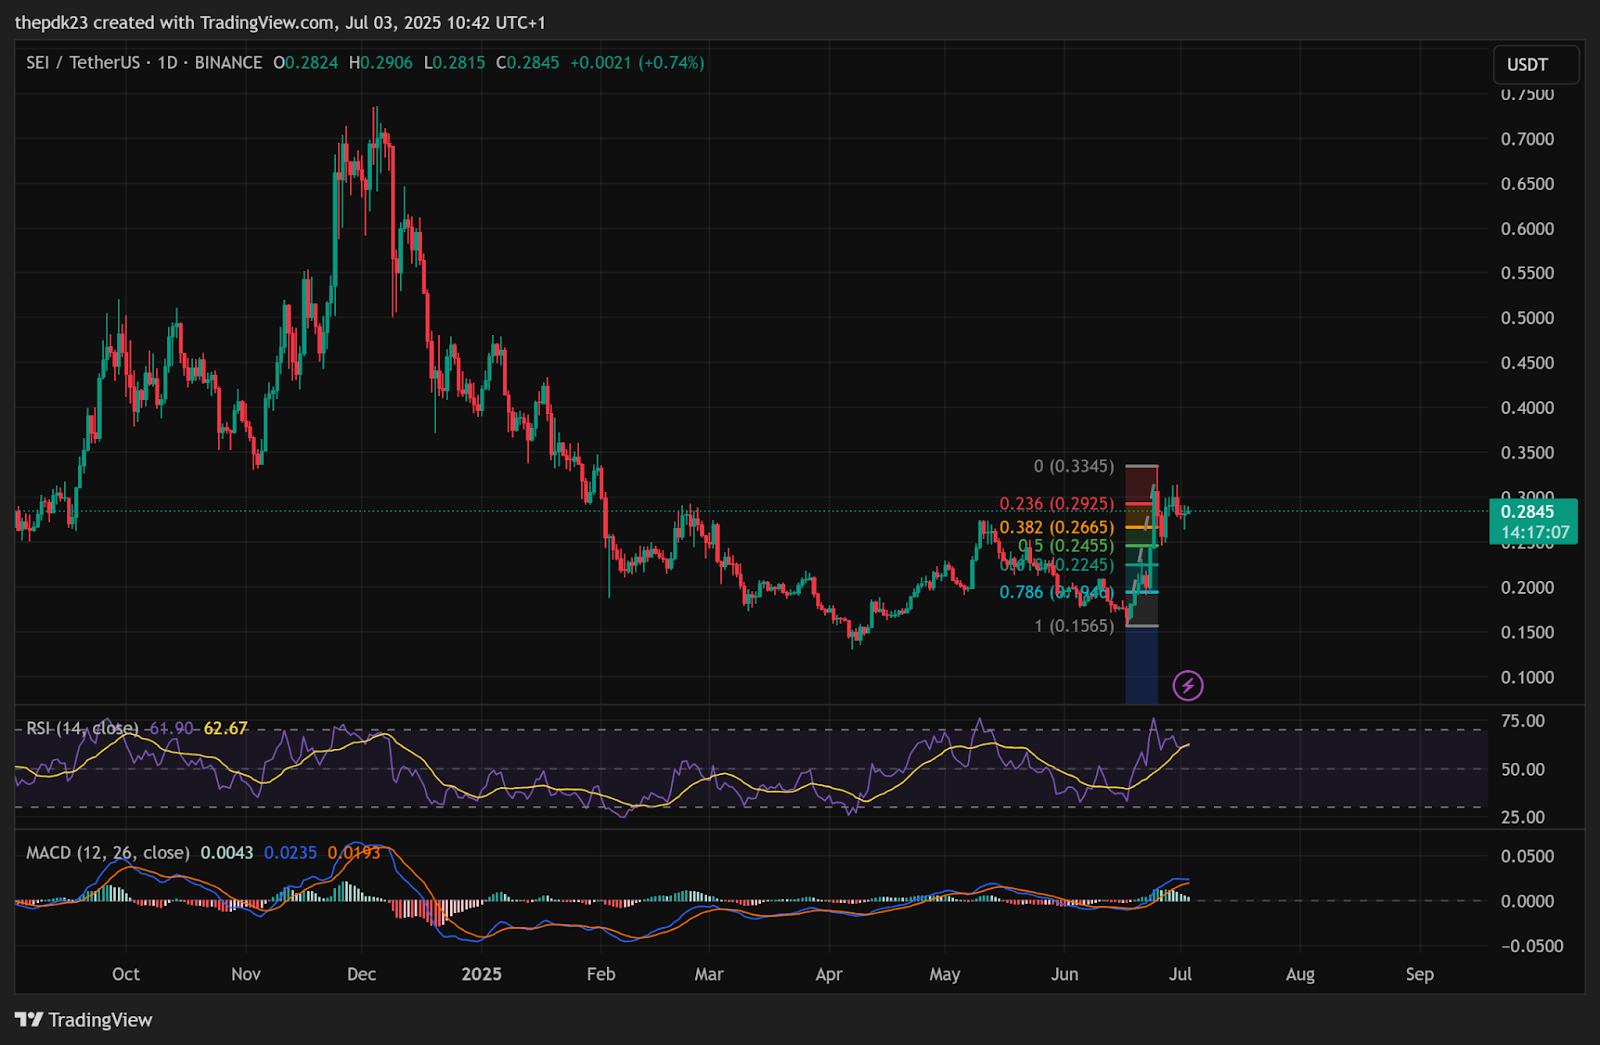
SEI Daily Chart with Fib levels | Source: TradingView
Fibonacci retracement levels drawn from the recent local high and low show SEI consolidating just below the 0.236 level at $0.2925, while maintaining strength above the 0.382 and 0.5 retracement zones around $0.2665 and $0.2455.
This confirms the move as a healthy pullback and sets the stage for a retest of $0.3345, followed by continuation toward higher targets.
next