
Solana’s once-unshakable dominance is slipping as traders migrate to new networks but ETFs continue to attract inflows.
Solana SOL $89.71 24h volatility: 0.9% Market cap: $51.29 B Vol. 24h: $1.95 B slipped to its August lows around $156, following a sharp fall in its network dominance as traders rotated toward new high-activity chains like Hyperliquid and BNB Chain.
According to DefiLlama, Solana’s share of the Layer-1 transaction fee market has tumbled from above 50% at the start of the year to just 9% now. In contrast, Hyperliquid has captured 40% and BNB Chain 20%, mostly fueled by derivatives trading volume and increasing DeFi activity.
Momentum Loss Despite Headline Success
However, over the weekend, the network celebrated a series of major milestones, including the record-breaking debut of the Solana Staking ETF (BSOL) on the NYSE, Grayscale’s launch of the GSOL trust, and $284 million in Solana ETF inflows, according to SoSoValue data.
Additionally, Visa and Shopify continue to integrate Solana’s high-speed payment infrastructure, while Western Union’s decision to build stablecoin remittance rails exclusively on Solana also indicates massive fundamental strength.
Veni, vidi, vici. ⚔️
Solana conquered Wall Street in a (seriously!) record-setting week for the history books.
Meanwhile, sleepless devs dared to finalize their Colosseum entries at the last minute as the ecosystem repeated a familiar mantra: just one more hard quarter.
Here… pic.twitter.com/udQIgTUt7y
— Solana (@solana) November 2, 2025
However, these successes have failed to prevent SOL price decline along with the broader crypto market. The altcoin has crashed a massive 32% in the last 30 days, dropping to the 6th position in the market with a market cap of $86.57 billion, according to CoinMarketCap data.
Amid waning activity and sharp pullbacks, Solana DAT firm Forward Industries, Inc., which closed a $1.65 billion private placement to create the largest SOL corporate treasury, holds 6.82 million SOL purchased at an average price of $232. The position is now worth $1.2 billion, reflecting a 24.13% unrealized loss totaling $382 million.
Notably, the company’s shares have crashed a massive 73.6% from their $39.6 peak to $10.44, resulting in a $900 million market cap, below its SOL holdings value (mNAV < 1).
Market cap under their SOL stash, either bargain buy or accounting nightmare
— Wiltshire (@WiltshireSolid) November 5, 2025
SOL Price Analysis: Testing Key Demand Zone
At the time of writing, SOL faces critical support between $155 and $160, as seen in the chart below. The token has broken below its descending trendline and the middle Bollinger Band, with RSI dipping near oversold territory at 30.25.
Momentum indicators such as MACD remain bearish, indicating that the recovery could be gradual unless SOL closes above the $185–$190 zone. Interestingly, the BoP shows that sellers still hold dominance, but early signs of accumulation are visible on lower timeframes.
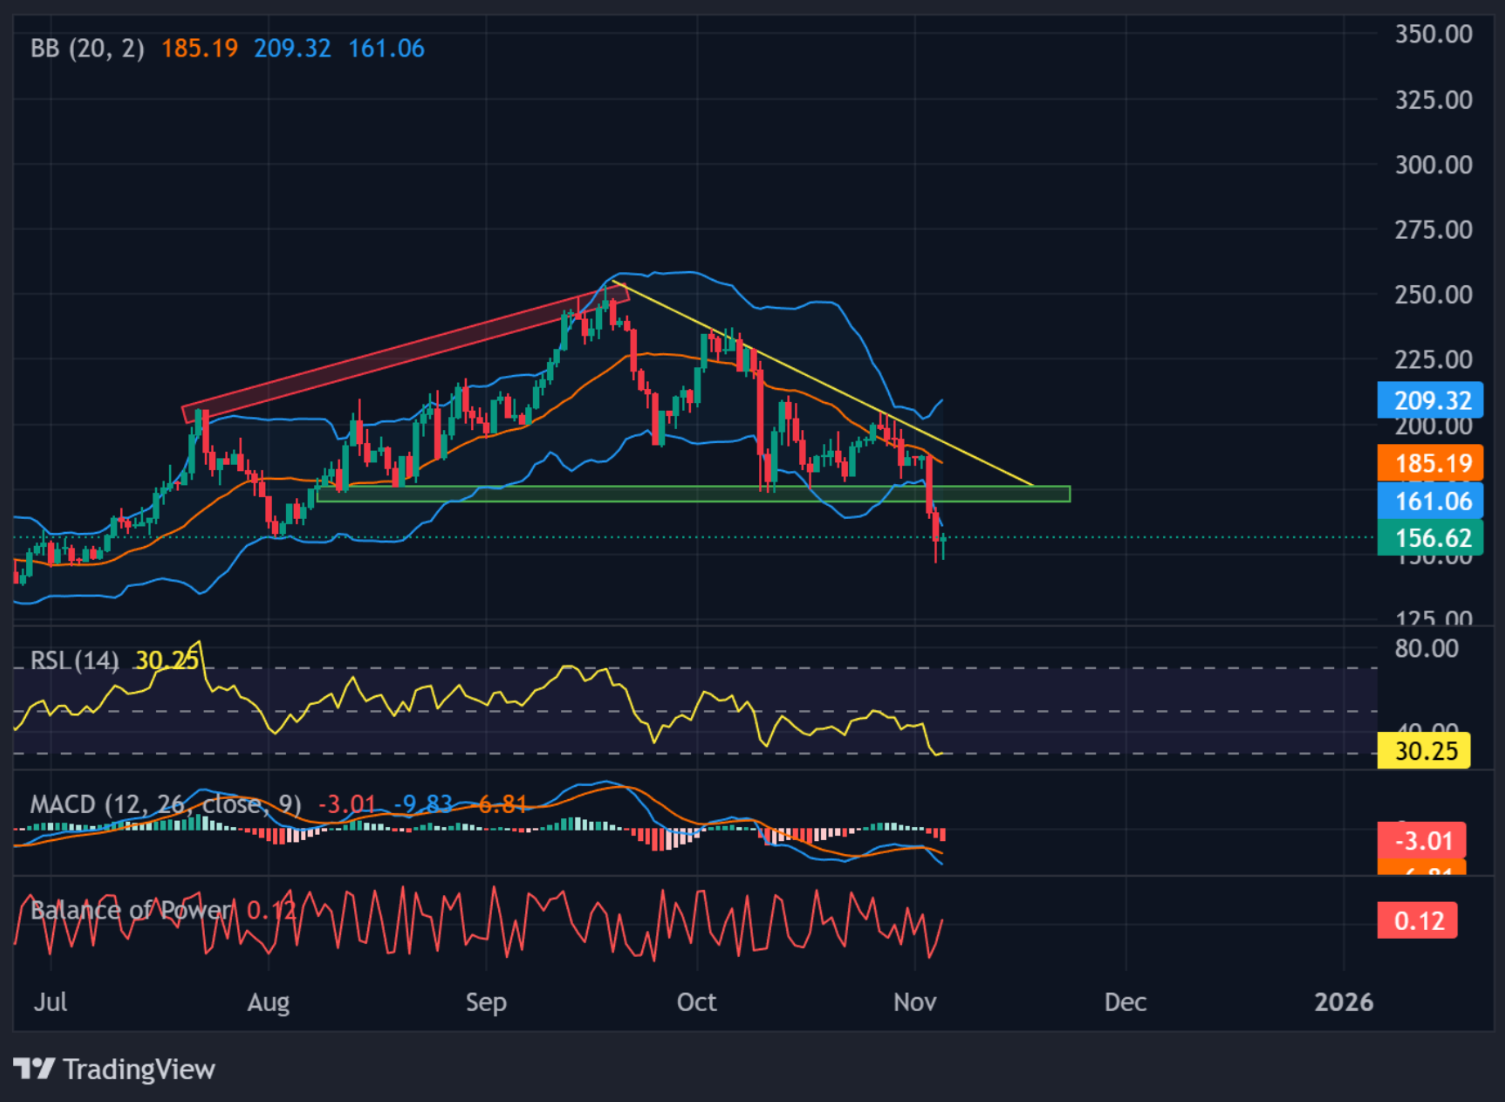

SOL price chart with momentum indicators | Source: TradingView
If buyers manage to reclaim that level, the next upside target lies near $210–$225, aligning with the upper Bollinger Band. According to the Solana price prediction, failure to defend current support, however, could drag prices toward $140–$130, an area that coincides with the lower Bollinger boundary support.
next