 Fact-Checked by:
 16 mins
 In the competitive world of crypto yield generation, CoinDepo and WhiteBIT Earn have built notable reputations as centralized plat...
Solana Price Prediction 2026-2036
Solana is trading at $64.82 as of June 10, 2026. Over the past 30 days, its price has moved higher, while over the last 24 hours, SOL has ticked upward.
Our model factors in recent price momentum, historical volatility, and broader market dynamics. Based on these inputs, Solana’s short-term outlook appears uncertain, with the next 24-hour projection shown below. For longer horizons, our scenario-based forecasts estimate SOL around $64.82 by the end of 2026.
Exploring potential Solana price targets
This Solana price prediction breaks down where SOL might go across short-, medium-, and long-term time horizons within the crypto space. We analyze historical trends, technical signals, on-chain activity, and macro conditions to build a picture of where SOL could head. Use this as a starting point for your own research – not as a buy or sell recommendation.
Solana Live Price & Market Snapshot – June 10, 2026
| Current price | $64.82 |
| 24h change | +0.56% |
| Market cap | $38.16B |
| Circulating supply | 588.68M |
| Total supply | 588.68M |
| All-time high | $294.16 |
SOL has shown some softness over the past week, indicating that sellers remain in control for now. Zooming out to a 30-day view, the trend looks healthy, with higher lows forming on the chart.
What’s changed for Solana since the last cycle is execution. The network has now logged over 480 billion transactions and Firedancer, a second independent validator client that Jump Crypto built, has reached mainnet-beta via Frankendancer. This second validator client reduces single-client risk as adoption grows.
The FTX overhang is also massively reduced. The estate has already sold a large part of its locked SOL position, removing a persistent source of sell pressure that has dogged the token since March 2024. With that headwind gone and on-chain activity accelerating, the setup looks cleaner than it has in years.
Quick Forecast – Solana Price Predictions at a Glance
Our SOL SOL $65.11 24h volatility: 0.8% Market cap: $37.73 B Vol. 24h: $2.96 B price projections draw on historical price action, technical indicators, network fundamentals, macro trends, and third-party analyst estimates. The table below lays out low, average, and high scenarios across key timeframes of Solana’s future:
| Year | Potential Low | Average | Potential High |
| 2026 | $64.82 | $64.82 | $64.82 |
| 2030 | $94.82 | $134.19 | $184.71 |
| 2036 | $118.68 | $209.91 | $360.02 |
Think of these as scenario brackets, not predictions carved in stone. For example, the potential low captures a bearish path – extended macro tightening, fading developer interest, or a major network incident.
The average price reflects where SOL would land if growing adoption trends hold and nothing shifts dramatically. The potential high assumes everything clicks: sustained DeFi growth, Firedancer delivering on throughput gains, and institutional allocators warming up to SOL as a core portfolio position.
Solana Short-Term Price Outlook (Next 30 Days)
Over the last seven days, the SOL price slipped to $64.82 (-11.65%). In the past month, it held onto gains despite broader chop.
| Date | Potential Low | Average Price | Potential High |
|---|---|---|---|
| June 11, 2026 | $64.84 | $64.86 | $64.93 |
| June 12, 2026 | $64.86 | $64.90 | $65.04 |
| June 13, 2026 | $64.88 | $64.94 | $65.15 |
| June 14, 2026 | $64.90 | $64.98 | $65.25 |
| June 15, 2026 | $64.92 | $65.02 | $65.36 |
| June 16, 2026 | $64.95 | $65.06 | $65.47 |
| June 17, 2026 | $64.97 | $65.10 | $65.58 |
| June 18, 2026 | $64.99 | $65.14 | $65.68 |
| June 19, 2026 | $65.01 | $65.18 | $65.79 |
| June 20, 2026 | $65.03 | $65.22 | $65.90 |
| June 21, 2026 | $65.05 | $65.26 | $66.00 |
| June 22, 2026 | $65.07 | $65.30 | $66.12 |
| June 23, 2026 | $65.09 | $65.34 | $66.23 |
| June 24, 2026 | $65.11 | $65.38 | $66.33 |
| June 25, 2026 | $65.13 | $65.42 | $66.44 |
| June 26, 2026 | $65.16 | $65.46 | $66.56 |
| June 27, 2026 | $65.18 | $65.50 | $66.65 |
| June 28, 2026 | $65.20 | $65.54 | $66.76 |
| June 29, 2026 | $65.22 | $65.58 | $66.88 |
| June 30, 2026 | $65.24 | $65.62 | $66.98 |
| July 1, 2026 | $65.26 | $65.66 | $67.09 |
| July 2, 2026 | $65.28 | $65.70 | $67.19 |
| July 3, 2026 | $65.30 | $65.73 | $67.29 |
| July 4, 2026 | $65.32 | $65.77 | $67.40 |
| July 5, 2026 | $65.34 | $65.81 | $67.51 |
| July 6, 2026 | $65.36 | $65.86 | $67.62 |
| July 7, 2026 | $65.39 | $65.90 | $67.75 |
| July 8, 2026 | $65.41 | $65.94 | $67.85 |
| July 9, 2026 | $65.43 | $65.98 | $67.95 |
| July 10, 2026 | $65.45 | $66.02 | $68.06 |
The next 30 days hinge on three things: Fed tone, DC policy noise, and whether Solana’s network remains functional without hiccups. First, macro factors. The FOMC meets on January 27-28, and while the market expects rates to hold, language matters. A dovish lean gives high-beta assets (like SOL) room to run. But a hawkish surprise, or hotter-than-expected inflation data, could trigger rapid de-risking.
Second, regulation. Congress plans Senate hearings on a US crypto market structure bill sometime in Q1, and SEC Chair Paul Atkins has floated an “innovation exemption” that could land within weeks. Progress here would lift sentiment across Bitcoin and altcoins; delays or political pushback would do the opposite.
Third, Solana-specific execution. Firedancer is live in mainnet-beta via Frankendancer, but traders are watching for Alpenglow updates and any mainnet milestones that signal the next performance leap. The flip side is reliability: Solana’s outage history means traders quickly price in any congestion or downtime.
With SOL still finding a floor, a clean run of uptime plus a bullish macro backdrop could set up a sharp reversal higher.
Solana Medium-Term Forecast 2026-2027
Over the next 12 months, three forces will shape SOL’s trajectory: Fed policy across eight FOMC meetings, whether spot SOL ETFs gain traction with institutional allocators, and execution on Alpenglow. The SIMD-0411 tokenomics overhaul may also impact SOL’s price.
Here’s our SOL price forecast through 2026:
| Month | Potential Low | Average Price | Potential High |
|---|---|---|---|
| July 2026 | $65.50 | $66.17 | $66.85 |
| August 2026 | $66.16 | $67.50 | $68.84 |
| September 2026 | $66.84 | $68.87 | $70.89 |
| October 2026 | $67.52 | $70.23 | $72.93 |
| November 2026 | $68.20 | $71.59 | $74.97 |
| December 2026 | $68.88 | $72.94 | $77.00 |
| January 2027 | $69.56 | $74.30 | $79.03 |
| February 2027 | $70.22 | $75.63 | $81.03 |
| March 2027 | $70.88 | $76.94 | $83.01 |
| April 2027 | $71.52 | $78.22 | $84.92 |
| May 2027 | $72.23 | $79.64 | $87.05 |
| June 2027 | $72.89 | $80.95 | $89.02 |
If current momentum continues, SOL could extend its half-year rally and test previous cycle highs by mid-2026.
The biggest on-chain event to watch is Alpenglow, the consensus upgrade that validators approved with over 98% support. If Anza hits its early 2026 mainnet target, Solana gets sub-200ms finality – a meaningful edge for decentralized finance and high-frequency use cases. Any delay, though, revives the “execution risk” narrative that’s dogged the chain before.
Tokenomics are changing, too. SIMD-0411 seeks to double Solana’s annual disinflation rate from 15% to 30%, thereby cutting long-run emissions by reaching the 1.5% terminal rate sooner. Galaxy Research expects activation around mid-2026 if the vote passes. Bulls see lower sell pressure; bears worry about squeezed validator margins.
Then there’s the ETF angle. Morgan Stanley filed for spot BTC and SOL ETFs in January 2026, and issuers have been positioning for SEC approval windows since late 2025. Hard inflows aren’t guaranteed, but the “institutionalization” narrative alone can move SOL, especially if BlackRock or Fidelity enters the race.
Solana Long-Term Price Forecast 2026-2036
Over the next decade, SOL’s value case comes down to one question: Does Solana become a durable financial infrastructure, or does it stay a fast-but-fragile blockchain that spikes during bull runs and bleeds during drawdowns?
Here’s our 10-year SOL price forecast:
| Year | Potential Low (ROI) | Average Price (ROI) | Potential High (ROI) |
|---|---|---|---|
| 2027 | $72.50 (11.85%) | $80.18 (23.69%) | $87.85 (35.54%) |
| 2028 | $80.18 (23.70%) | $97.18 (49.92%) | $115.81 (78.66%) |
| 2029 | $87.69 (35.28%) | $115.39 (78.02%) | $148.39 (128.93%) |
| 2030 | $94.82 (46.28%) | $134.19 (107.01%) | $184.71 (184.95%) |
| 2031 | $101.35 (56.36%) | $152.76 (135.67%) | $223.20 (244.33%) |
| 2032 | $107.09 (65.22%) | $170.20 (162.58%) | $261.66 (303.68%) |
| 2033 | $111.85 (72.55%) | $185.52 (186.21%) | $297.41 (358.82%) |
| 2034 | $115.44 (78.10%) | $197.77 (205.11%) | $327.49 (405.23%) |
| 2035 | $117.75 (81.66%) | $206.11 (217.97%) | $349.12 (438.60%) |
| 2036 | $118.68 (83.08%) | $209.91 (223.83%) | $360.02 (455.42%) |
If adoption continues at the current pace, SOL stands to benefit from compounding usage and tightening supply dynamics by 2030.
The supply picture is worth watching. Solana’s inflation started at 8% and has been declining by 15% per year, trending toward a terminal rate of 1.5%. Galaxy Research pegged current inflation at roughly 4.18%. As emissions shrink and transaction fee burns chip away at supply, the math starts to favor holders, assuming demand keeps up.
Bitcoin’s halving cycles matter indirectly, too. The next two halvings land around April 2028 and 2032, and historically, volatile assets like SOL have outperformed during the liquidity waves that follow. That’s not guaranteed, but it’s a pattern worth factoring in.
Regulation cuts both ways. MiCA’s transition period runs through mid-2026, after which compliant custody and distribution of SOL products in Europe becomes simpler. In the US, spot ETF filings from Morgan Stanley and other banks suggest that institutional interest and wrappers are coming. The question now is timing.
The bear case? Ethereum, newer Layer 1s, and the occasional breakout new cryptocurrency keep chipping away at developer mindshare, and Solana’s outage history makes institutions hesitant to commit. As such, SOL’s upside depends on proving it can handle institutional-grade uptime.
Ultimately, we forecast an average SOL price of $134.19 in 2030, with a potential high of $184.71 and a possible low of $94.82.
Methodology for Price Predictions
We build our SOL forecasts on five inputs, each weighted by timeframe and market conditions:
- Historical price analysis: We study SOL’s behavior across multiple timeframes – daily swings, weekly trends, and complete bull/bear cycles – to identify recurring patterns.
- Sentiment tracking: We monitor sentiment on X, Reddit, Discord, and crypto news outlets, plus analyst commentary and prediction market positioning. We adjust sentiment scores manually when major news shifts the narrative.
- Volatility modeling: We measure price swings across 1-day, 7-day, 180-day, and 3-year windows. Higher volatility widens our forecast ranges; lower volatility tightens them.
- Technical signals: We use simple moving averages (SMA), relative strength index (RSI), and trendline analysis to gauge momentum and identify potential support/resistance zones.
- Macro overlay: SOL trades like a volatile risk asset, so we factor in Fed rate expectations, inflation prints, and broader risk appetite.
Prediction Scenarios
We don’t give you a single number. Instead, we offer you a range:
- Potential Low: A conservative case assuming macro headwinds, slower adoption, or network setbacks.
- Average: The most probable outcome given where SOL sits right now.
- Potential High: An optimistic scenario where spot ETF flows, Alpenglow execution, and bull market conditions all align.
Our model adjusts dynamically based on SOL’s market capitalization and liquidity profile. But nothing is certain in crypto, so treat these predictions as directional guides.
What Analysts Predict
Institutional-grade SOL forecasts are less common than for BTC or ETH, but a handful of credible sources have published explicit targets:
- Standard Chartered sees SOL reaching $500 by 2029. Geoff Kendrick, the bank’s head of digital assets research, uses a market-cap-to-“blockchain GDP” model and argues SOL looks undervalued relative to its on-chain activity. He warns, though, that SOL may underperform ETH until 2027.
- VanEck published a wide range of scenarios: roughly $9.81 (bear) to $3,211 (bull) by 2030, with a baseline around $335. The bull case assumes Solana scales to 100M+ daily active users.
- Finder’s expert panel (26 crypto specialists surveyed in April 2025) averaged $892 by year-end 2030. Panelists cited continued DeFi growth and multiple spot SOL ETFs as key drivers of demand.
The spread (from sub-$50 to over $3,000) reflects analysts’ uncertainty about whether Solana can transform raw throughput into durable, diversified usage.
Bullish vs Bearish Scenarios
Here’s what could push SOL price growth higher – and what could send it lower:
Bullish Catalysts
- Spot ETF progress: Morgan Stanley has already filed for a spot SOL ETF, and more issuers are lining up to do the same. If approvals land and inflows follow, it opens SOL to allocators who can’t touch crypto directly.
- Regulatory tailwinds: Clearer US market structure rules or an SEC “innovation exemption” would reduce compliance friction for exchanges and custodians, making SOL easier to list and custody at scale.
- Network upgrades landing: Firedancer is live, and Alpenglow is next. If Solana keeps shipping performance wins without outages, the “institutional-grade chain” narrative gets a lot stronger.
- Tokenomics tightening: SIMD-0411 could double the disinflation rate, cutting long-run emissions. Less sell pressure, same demand – that math favors holders.
Bearish Risks
- Outage risk: Solana SOL has experienced seven major outages over the past five years. One bad congestion event during a demand spike, and traders re-price reliability risk fast.
- Macro headwinds: SOL is highly sensitive to market swings. A hawkish Fed or inflation scare can crush altcoins regardless of fundamentals.
- Competition: Ethereum Layer 2s and newer chains keep improving. If rivals match Solana’s speed without the outage baggage, SOL’s premium erodes.
Unknown Variables
Black swan events (exchange blow-ups, hacks, geopolitical shocks) remain impossible to model. Quantum computing is a longer-term wildcard, but any credible timeline shift would hit the entire market, not just SOL.
Should You Invest in Solana?
Our SOL price prediction leans bullish long-term, but that doesn’t mean it’s the right fit for your portfolio. You must consider volatility before buying Solana. SOL crashed over 90% from its 2021 highs during the FTX fallout and has seen 30%+ swings in a single month more than once.
Also, think about your investment timeline. Solana has gone through brutal multi-year stretches where holders continually bled out. If you need your capital within 12–24 months, parking it in a high-beta altcoin is a gamble.
Finally, check your existing exposure. SOL moves with risk assets – it’s highly correlated to BTC, ETH, and tech stocks. If you’re already loaded up on NASDAQ or other altcoins, adding SOL just concentrates that bet further.
If you decide to buy, store SOL in one of the best crypto wallets rather than leaving it on an exchange. Also, make sure to do your own research and never invest more than you can afford to lose.
Solana Price Chart and Historical Performance
SOL was launched in March 2020 by Solana Labs and bottomed at around $0.50 in May of that year. What followed was one of the most aggressive runs in crypto history.
By November 2021, SOL had surged past $250, benefiting from the broader bull market and a wave of activity around NFTs and early Solana meme coins. Yet cracks showed early: a 17-hour outage in September 2021 tanked the token’s price by 12% in a day, a sign that reliability headlines could override momentum even during euphoric phases.
The 2022 bear market hit the SOL token harder than most altcoins. Repeated outages (including a 12% single-day drop in June 2022) compounded macro pain, and then FTX collapsed in November. Alameda and FTX were deeply tied to Solana’s ecosystem, so the contagion was brutal. By December 2022, SOL had bottomed around $8, down over 95% from its highs.
The recovery took time. Through 2023 and into 2024, SOL clawed back ground as the network stabilized and developer activity picked up. April 2024 brought another congestion scare, but the damage was contained.
Then came the breakout: SOL hit a new all-time high of $293.31 on January 19, 2025. After that, SOL cooled off with the rest of the market, grinding through a choppy second half of the year before steadying in early 2026.

Solana (SOL)
24h7d30d1yAll time
SOL trades at $64.82 (+0.56%) as of June 10, 2026.
Solana Technical Analysis and Key Indicators
Technical analysis won’t tell you where SOL is headed, but it can show you where the asset sits relative to its recent trend, and whether momentum favors buyers or sellers.
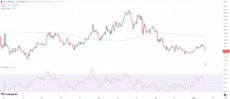
SOL’s daily price chart with 200-day SMA and 14-day RSI. Source: TradingView
The chart above plots SOL against its 200-day simple moving average (SMA) and the 14-day relative strength index (RSI). The 200-day SMA smooths out roughly six months of price action and often acts as a line in the sand for trend direction.
SOL is trading well below its SMA: around $129, versus $172. That gap signals the medium-term trend is weak. Bulls would need to reclaim the 200-day SMA and hold above it before the technical picture shifts constructively.
The RSI tracks momentum on a 0-100 scale. Above 70 typically flags overbought conditions; below 30 suggests oversold. SOL’s RSI sits around 41, which is below neutral, but not yet washed out. It’s the kind of reading you see when selling pressure has faded, but buyers haven’t stepped in with conviction.
Put together: SOL is in a weak technical posture. Price is below the 200-day SMA, and the RSI is soft but not capitulating. A catalyst (macro, network, or ETF-related) would likely be needed to shift momentum.
US and Global Regulatory & Tax Considerations
- United States: The IRS classifies SOL as property. Short-term gains (held ≤1 year) are taxed at ordinary income rates (10–37%); long-term gains (>1 year) at 0–20%. SOL is available on Coinbase, Kraken, and Binance.US, though availability varies by state.
- European Union: SOL falls under MiCA’s harmonized framework, which standardizes licensing for crypto service providers across member states. Tax treatment varies; for example, Germany exempts gains after one year, while France applies a flat 30% rate.
- United Kingdom: HMRC treats SOL as property subject to capital gains tax (10-20% depending on income band). HMRC’s Cryptoassets Manual provides detailed guidance. SOL trades on Coinbase UK and Kraken.
- Asia-Pacific: Japan treats SOL as a legal crypto asset and taxes gains at up to 55% (as miscellaneous income). Singapore has no capital gains tax for individuals. Australia applies a 50% discount on capital gains for assets held for more than 12 months.
Forecasts represent possible scenarios based on current information, not guarantees. Cryptocurrency markets are highly volatile and unpredictable. Past performance does not indicate future results.
FAQ
What will Solana be worth in 2026?
Can Solana reach $1,000?
Is Solana a good investment?
How accurate are crypto price predictions?
What factors affect Solana’s price?
Where can I buy Solana?
References
- Solana Explorer (Solana.com)
- SIMD-0411: Proposal for Doubling the Disinflation Rate (Solana.com)
- Solana’s SIMD-0411 Proposal: Another Stab at Reducing SOL Inflation (Galaxy)
- MiCA Regulation: 2026 Guide for Licensing & Compliance (Adam Smith Corporate Lab)
- Solana Price Prediction Hits $500 by 2029, Says Standard Chartered (Binance Square)
- VanEck’s Base, Bear, Bull Case: Solana Valuation by 2030 (VanEck)
- Solana (SOL) Price Prediction 2025, 2030 & 2035 (Finder.com)
- A Complete History of Solana Outages: Causes, Fixes, and Lessons Learnt (Helius)
Coinspeaker in Numbers
250K+
Monthly Users
80+
Articles & Guides
5000+
Research Hours
23
Authors
guides
CoinDepo vs. WhiteBIT Earn Comparison: Yields, Features, Security and More
June 2nd, 2026
Divine Ray (DRC) Price Prediction 2026-2030
June 1st, 2026
How to Make Your Crypto Work For You: 4 Different Methods to Explore
May 7th, 2026
Although most Web3 social platforms struggle to move beyond the hype phase, Divine Ray has taken a more grounded route. Its team h...
For most holders, crypto sits in a wallet, doing nothing. But there are smart and relatively safe methods to generate between 5–25...
Otar Topuria
Crypto Editor, 41 postsI’m a crypto writer and analyst at Coinspeaker with over three years of experience covering fintech and the rapidly evolving cryptocurrency landscape. My work focuses on market movements, investment trends, and the narratives driving them, helping readers what is happening in the markets and why. In addition to Coinspeaker, my insights and analyses have been featured in other leading crypto and fintech publications, where I’ve built a reputation as a thoughtful and reliable voice in the industry.
My mission is to demystify the crypto markets and help readers navigate the noise, highlighting the stories and trends that truly matter. Before specializing in crypto, I worked in the IT sector, writing technical content on software development, digital innovation, and emerging technologies. That made me something of an expert in breaking down complex systems and explaining them in a clear, accessible way, skills I now find very useful when it comes to unpacking the intricate world of blockchain and digital assets.
I hold a Master’s degree in Comparative Literature, which sharpened my ability to analyze patterns, draw connections across disciplines, and communicate nuanced ideas. I’m particularly passionate about early-stage project discovery and crypto trading, areas where innovation meets opportunity. I enjoy exploring how new protocols, tokens, and DeFi projects aim to disrupt traditional systems, while also evaluating their potential risks and rewards. By combining market analysis with forward-looking research, I strive to provide readers with content that is both informative and actionable.