
SOL’s rally paused below $240 after staking withdrawals of 3.38 million tokens created selling pressure, while technical indicators and ETF approval odds keep bullish sentiment intact.
Solana SOL $77.35 24h volatility: 9.1% Market cap: $43.97 B Vol. 24h: $3.26 B price has struggled to sustain momentum after two consecutive days of 6% gains, rising only 3% on Friday, October 3. SOL price stalled just below the $240 psychological resistance, as on-chain data pointed to supply pressures from recent staking withdrawals.
On Friday, Solana briefly attempted to extend its winning streak, but gains capped at 3% as sellers re-emerged near $240. Since the US Fed rate cut on September 18, Solana total staking deposits have declined from 411.28 million SOL to 407.9 million at press time.

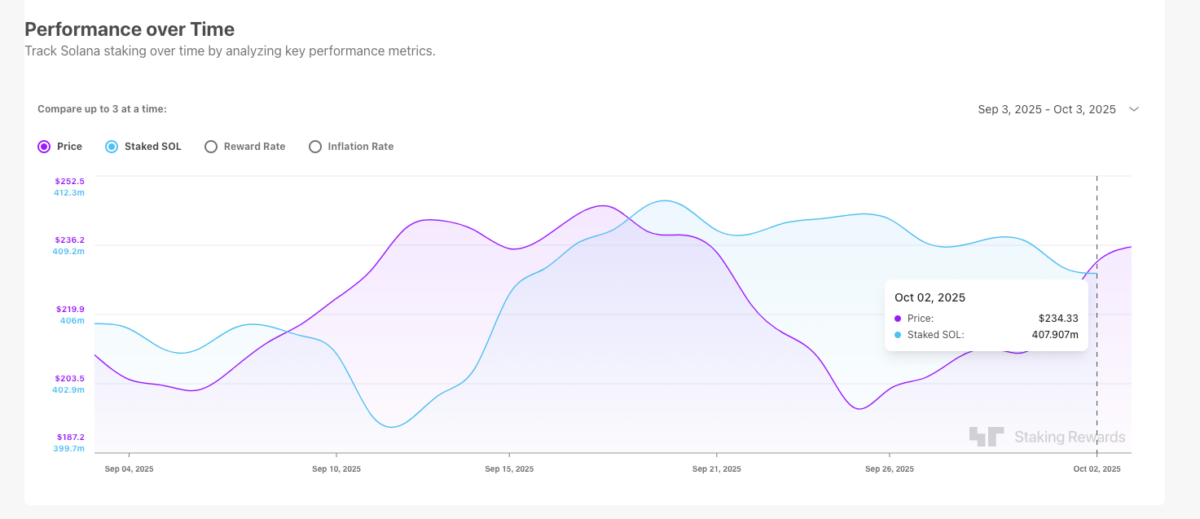
Solana total staking deposits decline 3.38 million SOL ($787M) between Sept. 19 and Oct. 3, 2025 | Source: StakingRewards
According to StakingRewards data, this represents 3.38 million SOL withdrawn in just two weeks, equivalent to $787 million at current prices of $233.
The release of such a large amount of previously locked tokens into circulation creates headwinds. It increases sell-side liquidity and makes it harder for rallies to sustain through psychological barriers.
Despite this, positive speculation surrounding Solana ETFs continues to intensify. On Sept. 29, Bloomberg’s Eric Balchunas declared approval odds for a Solana ETF as near certainty.
Honestly the odds are really 100% now. Generic listing standards make the 19b-4s and their “clock” meaningless. That just leaves the S-1s waiting for formal green light from Corp Finance. And they just submitted amendment #4 for Solana. The baby could come any day. Be ready. https://t.co/5JtfTm82Wi
— Eric Balchunas (@EricBalchunas) September 29, 2025
Anticipation around imminent spot ETF inflows and macro tailwinds from Fed easing is keeping demand alive, while persistent staking outflows present a near-term hurdle for Solana’s near-term price prospects.
Solana Price Forecast: Golden Cross Points to Upside, but Resistance Remains Firm
Solana’s recent rally above $230 has triggered another Golden cross formation. As seen below, the 5-day moving average crosses above both the 8-day and 13-day averages, marking the onset of another upside cycle.

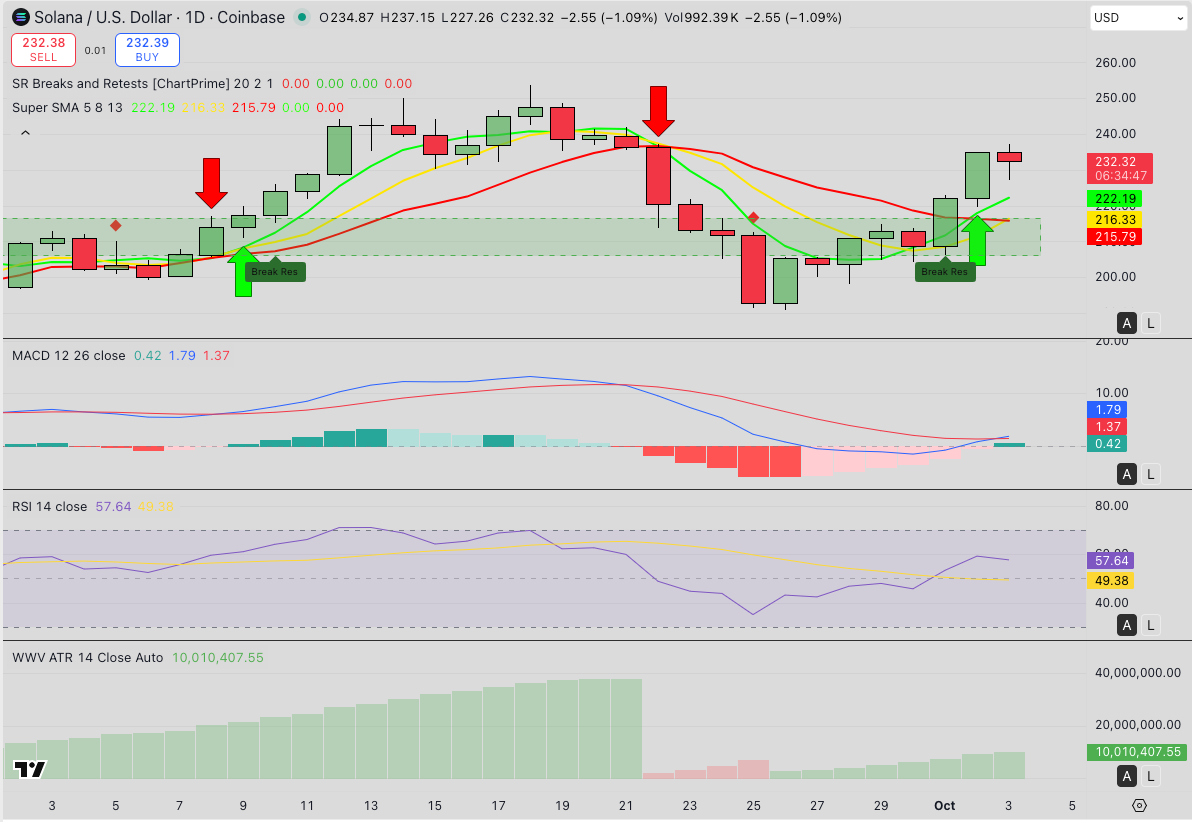
Solana (SOL) Technical Price Analysis | October 3, 2025
More so, the MACD indicator has flipped positive, with the MACD line crossing above the signal line at 1.80 vs 1.37, pointing toward growing bullish momentum. Meanwhile, the RSI sits at 57.6, leaving moderate room for more gains before overbought conditions kick in.
If SOL clears the $245 resistance band, it could trigger a breakout toward $280, where it faces another critical supply zone.
In the bearish scenario, rejection at $240 could see SOL slip back toward $220, if staking outflows amplify sell pressure.
next