
Should the Bears maintain their pressure or increase their momentum, further decrease in XRP price is certain and this may reach $0.39 demand level in case $0.42 level does not hold. Should the $0.42 level hold; the price may resume uptrend movement.
Key Highlights:
- The Bears are in control of the XRP market;
- XRP price broke down $0.46 level, targeting $0.42 level;
- in case $0.42 does not hold, $0.39 level may be reached.
XRP/USD Price Medium-term Trend: Bullish
Supply levels: $0.46, $0.49, $0.52
Demand levels: $0.42, $0.39, $0.35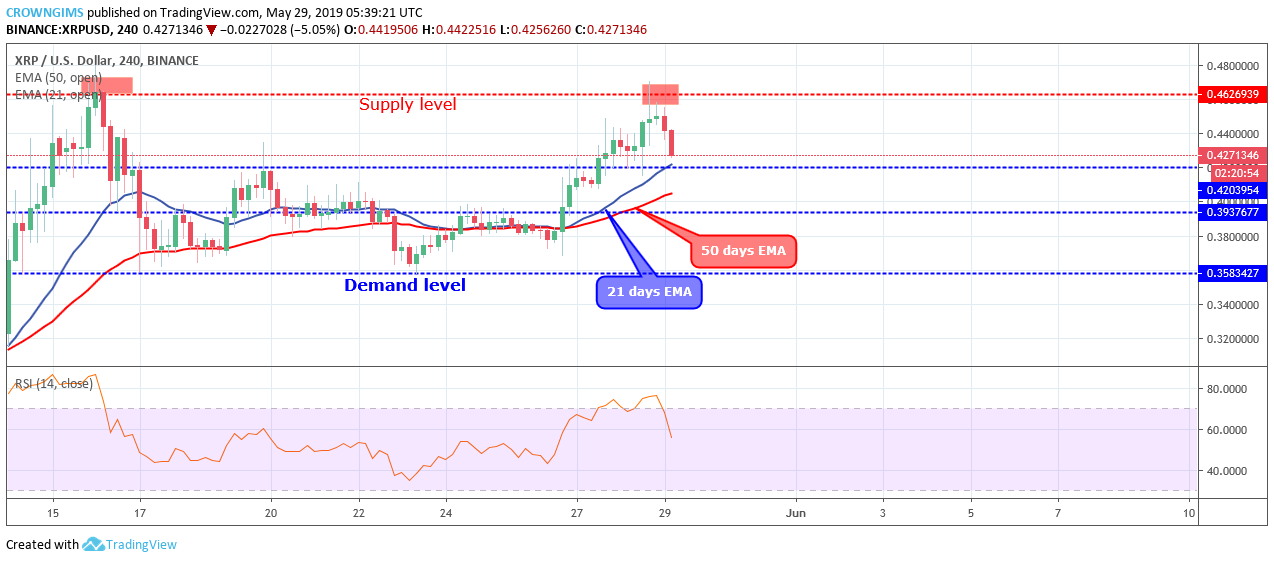

The coin has approached the level that looks like a strong resistance ($0.46). In fact, that will be the second time the crypto touched the level; the first touch was on May 16 and the coin could not break up the level. As at the moment, the price has produced an evening star candle pattern at the level and price reversed moving towards $0.42 demand level.
The coin is still trading above the 21 periods EMA and 50 periods EMA. The Relative Strength Index period 14 is at 60 levels with the signal line pointing down to indicate sell signal. Should the Bears maintain their pressure or increase their momentum, further decrease in price is certain and this may reach $0.39 demand level in case $0.42 level does not hold. Should the $0.42 level hold; XRP price may resume uptrend movement.
XRP/USD Price Short-term Trend: Bearish
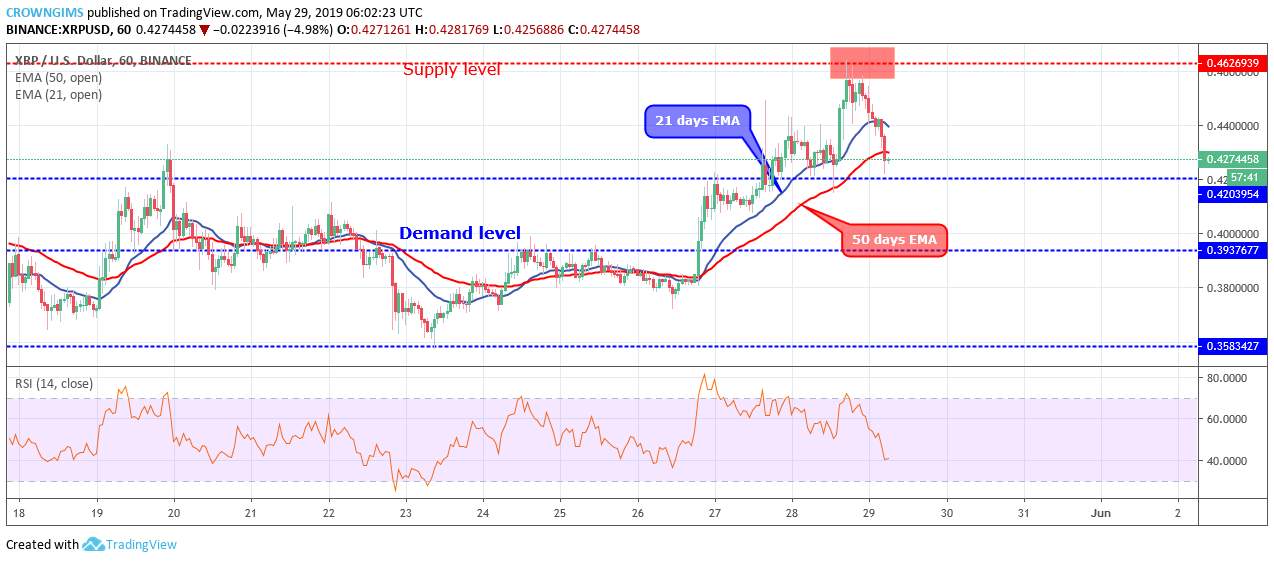
On the 1-hour chart, XRP price is penetrating the two EMAs to cross below 21 periods EMA and 50 periods EMA. Meanwhile, Relative Strength Index period 14 is at 40 levels and the signal line pointing down to indicate sell signal.
next