
Bitcoin reclaimed $65,000 in a low-liquidity rally as U.S. spot ETFs logged a second consecutive week of inflows and the CLARITY Act advances in the Senate. Here is what the data says about the next key levels.
The Bitcoin price reclaimed $66,000 this week, touching an intraday high of $66,300, its strongest print since mid-June, while posting a 24-hour gain of roughly 3% against a backdrop of thin order books and cooling US inflation data.
US spot Bitcoin ETFs logged just $75.7M in net inflows last week, their second consecutive positive week per CoinGlass data, yet that two-week recovery of $273.1M covers only 3.3% of the $8.2Bn that exited over the prior eight weeks.
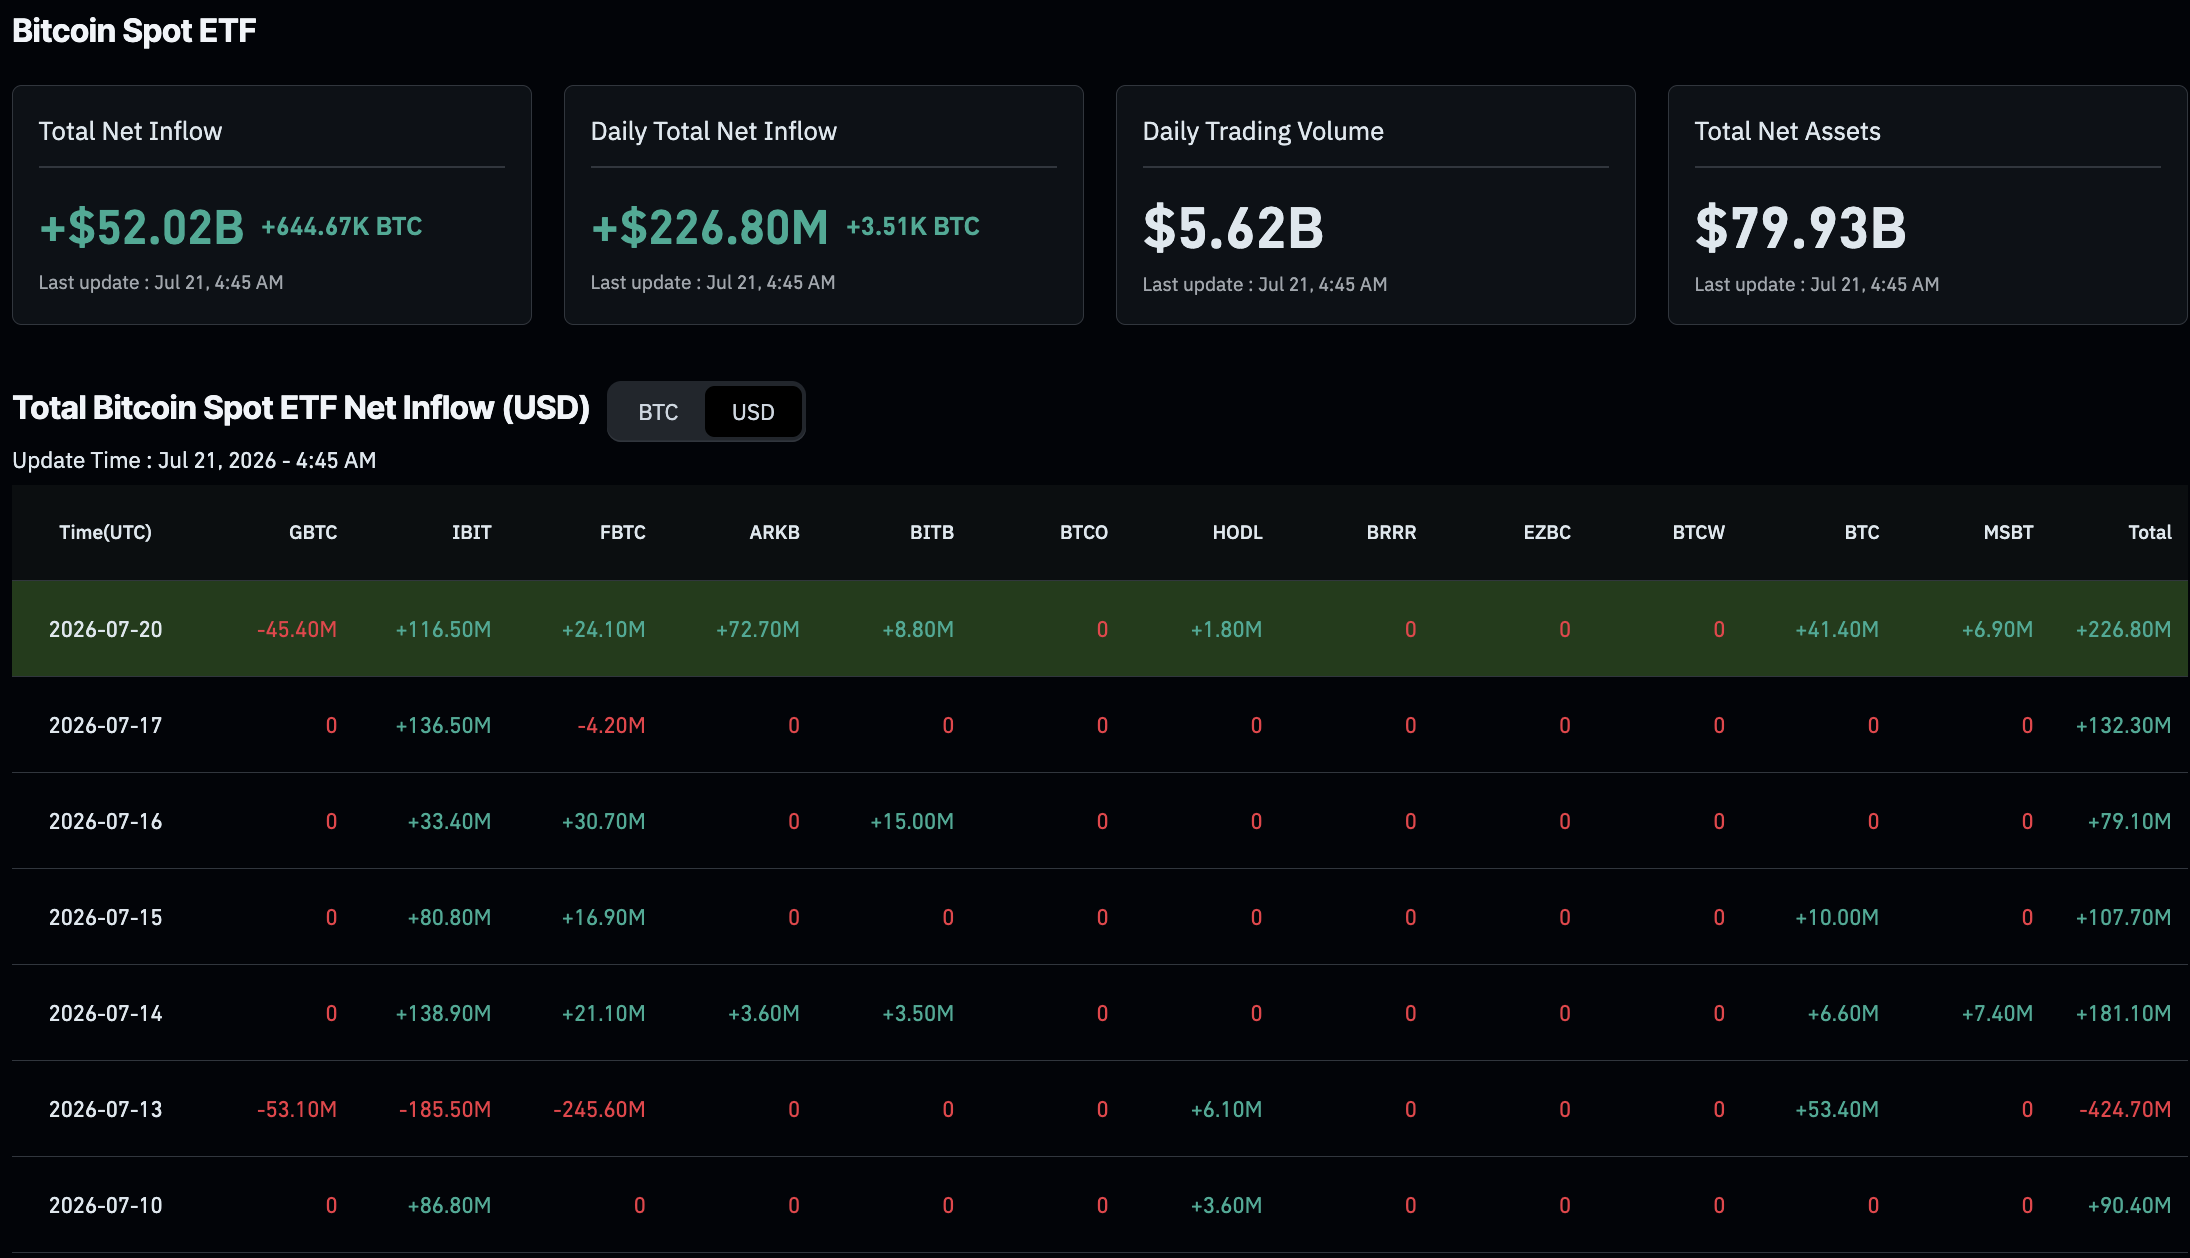

Meanwhile, Senate progress on the CLARITY Act, the Digital Asset Market Structure bill, is injecting a separate strand of optimism into the narrative, with the legislative timeline still subject to procedural risk.
What happens at the $64,000–$65,000 supply zone over the next several sessions will likely determine whether this is a trend shift or a retracement trap.
Can Bitcoin Price Reach $71,500 Before the July 29 FOMC Meeting?
$BTC has reclaimed the $65,000 level.
The next key resistance is $67,500-$68,000, which means Bitcoin has some room to pump.
If BTC manages to reclaim the $68,000 resistance too, it could rally another 5%-6% very quickly. pic.twitter.com/XPMb3aSU69
— Ted (@TedPillows) July 21, 2026
BTC is trading just above $66,000, with recent levels around $66,300. The 50-day SMA and EMA are converging in the $66,000–$67,000 zone, which analysts note needs to be convincingly reclaimed for a credible advance.
The thin liquidity raises the risk of sharp reversals, with the 20-day EMA at $63,000 serving as the first support level on a pullback. Below that, $60,000 and the 200-week moving average at $59,000 act as structural floors.
A drop below $65,900 could lead to $61,500 and $60,000, with $59,000 marking the boundary between a bull-market correction and a structural breakdown.
Three scenarios can be considered:
Bull Case: A solid close above $66,000 could push BTC towards $71,500, with resistance at $67,000 and $69,200–$72,600.
Base Case: A range between $63,000 and $67,000 until the July 29 FOMC meeting, influenced by the Fed’s rate guidance and ETF flows.
Bear Case: A rejection at current levels and a retest of $60,000. If that fails, BTC could drop to the $56,930 level noted by Cryptonomist.
DISCOVER: Best Meme Coins to Buy in 2026
Bitcoin Hyper Targets Early-Stage Positioning as BTC Tests Structural Resistance

A sustained move from $66,000 to $71,500 represents approximately a +10% upside in an asset with a market capitalization already measured in the trillions. For traders whose thesis is BTC ecosystem growth rather than Bitcoin price alone, the early-stage entry calculus looks different.
The CLARITY Act’s advancing regulatory framework is particularly relevant for infrastructure plays building within the Bitcoin ecosystem, projects whose addressable market expands materially if programmable Bitcoin use cases gain regulatory legitimacy.
Bitcoin Hyper ($HYPER) is positioning directly in that gap. The project claims the first-ever Bitcoin layer 2 with Solana Virtual Machine (SVM) integration, targeting sub-second finality and smart contract execution that, per its own benchmarks, exceeds Solana’s native throughput while anchoring security to Bitcoin’s base layer.
The presale has raised $32,973,904.37 at a current token price of $0.0136834, with staking active for participants looking to compound while the raise continues. The decentralized canonical bridge for BTC transfers and low-cost transaction execution are the two features most directly tied to the programmability gap the CLARITY Act is designed to legitimize.
Visit the Bitcoin Hyper Presale Website Here.
EXPLORE: Best Meme Coins to Buy in July
This article is for informational purposes only and does not constitute financial advice. Cryptocurrency investments are volatile; conduct your own research before making any decisions.
next