
ETH price analysis shows crypto traders adding exposure while US spot ETFs see outflows after the Fed hike and CLARITY Act setback.
Ethereum is currently trading near $2,440, up 1.7% over the prior 24 hours, even with some bad news. The price is holding above the $2,400 mark, and it has defended through two developments that might otherwise have triggered a sharper drawdown.
The news? A 25-basis-point Federal Reserve rate hike and the Senate’s failure to advance the CLARITY Act. Based on the latest Ethereum news, the Relative Strength Index sat at 53, a reading that points to consolidation rather than exhaustion in either direction.
The Federal Reserve raised its target rate by 25 basis points on Wednesday, its first hike in three years, lifting the federal funds range to 3.75%-4.00%. The Federal Open Market Committee reached the decision unanimously.
The vote: 12-0, with officials reiterating that reducing inflation remains their primary objective and most expecting one further hike before year-end. The move had been broadly priced in, with CME FedWatch odds above 90% ahead of the meeting after producer and consumer inflation both ticked higher the prior week.
JUST IN: 🇺🇸 Standard Chartered expects U.S. Fed to deliver a 25 bp rate hike in December. pic.twitter.com/ikiKRrpkmS
— Whale Insider (@WhaleInsider) September 17, 2026
Separately, the CLARITY Act’s progress stalled in the Senate on Tuesday after it failed to secure the 60 votes needed to invoke cloture. Market participants had largely anticipated that outcome too. Perhaps this explains the limited immediate price impact even as it extends the regulatory uncertainty affecting US-listed digital assets. Readers tracking the legislative mechanics in more depth can follow the Senate stall on the CLARITY Act for additional context on where the bill stands.
Market Intelligence: Crypto Analyst Predicts Best New Crypto to Hodl
Ethereum Price: Technical Levels Defining the Recovery

ETHUSDT Chart 1D
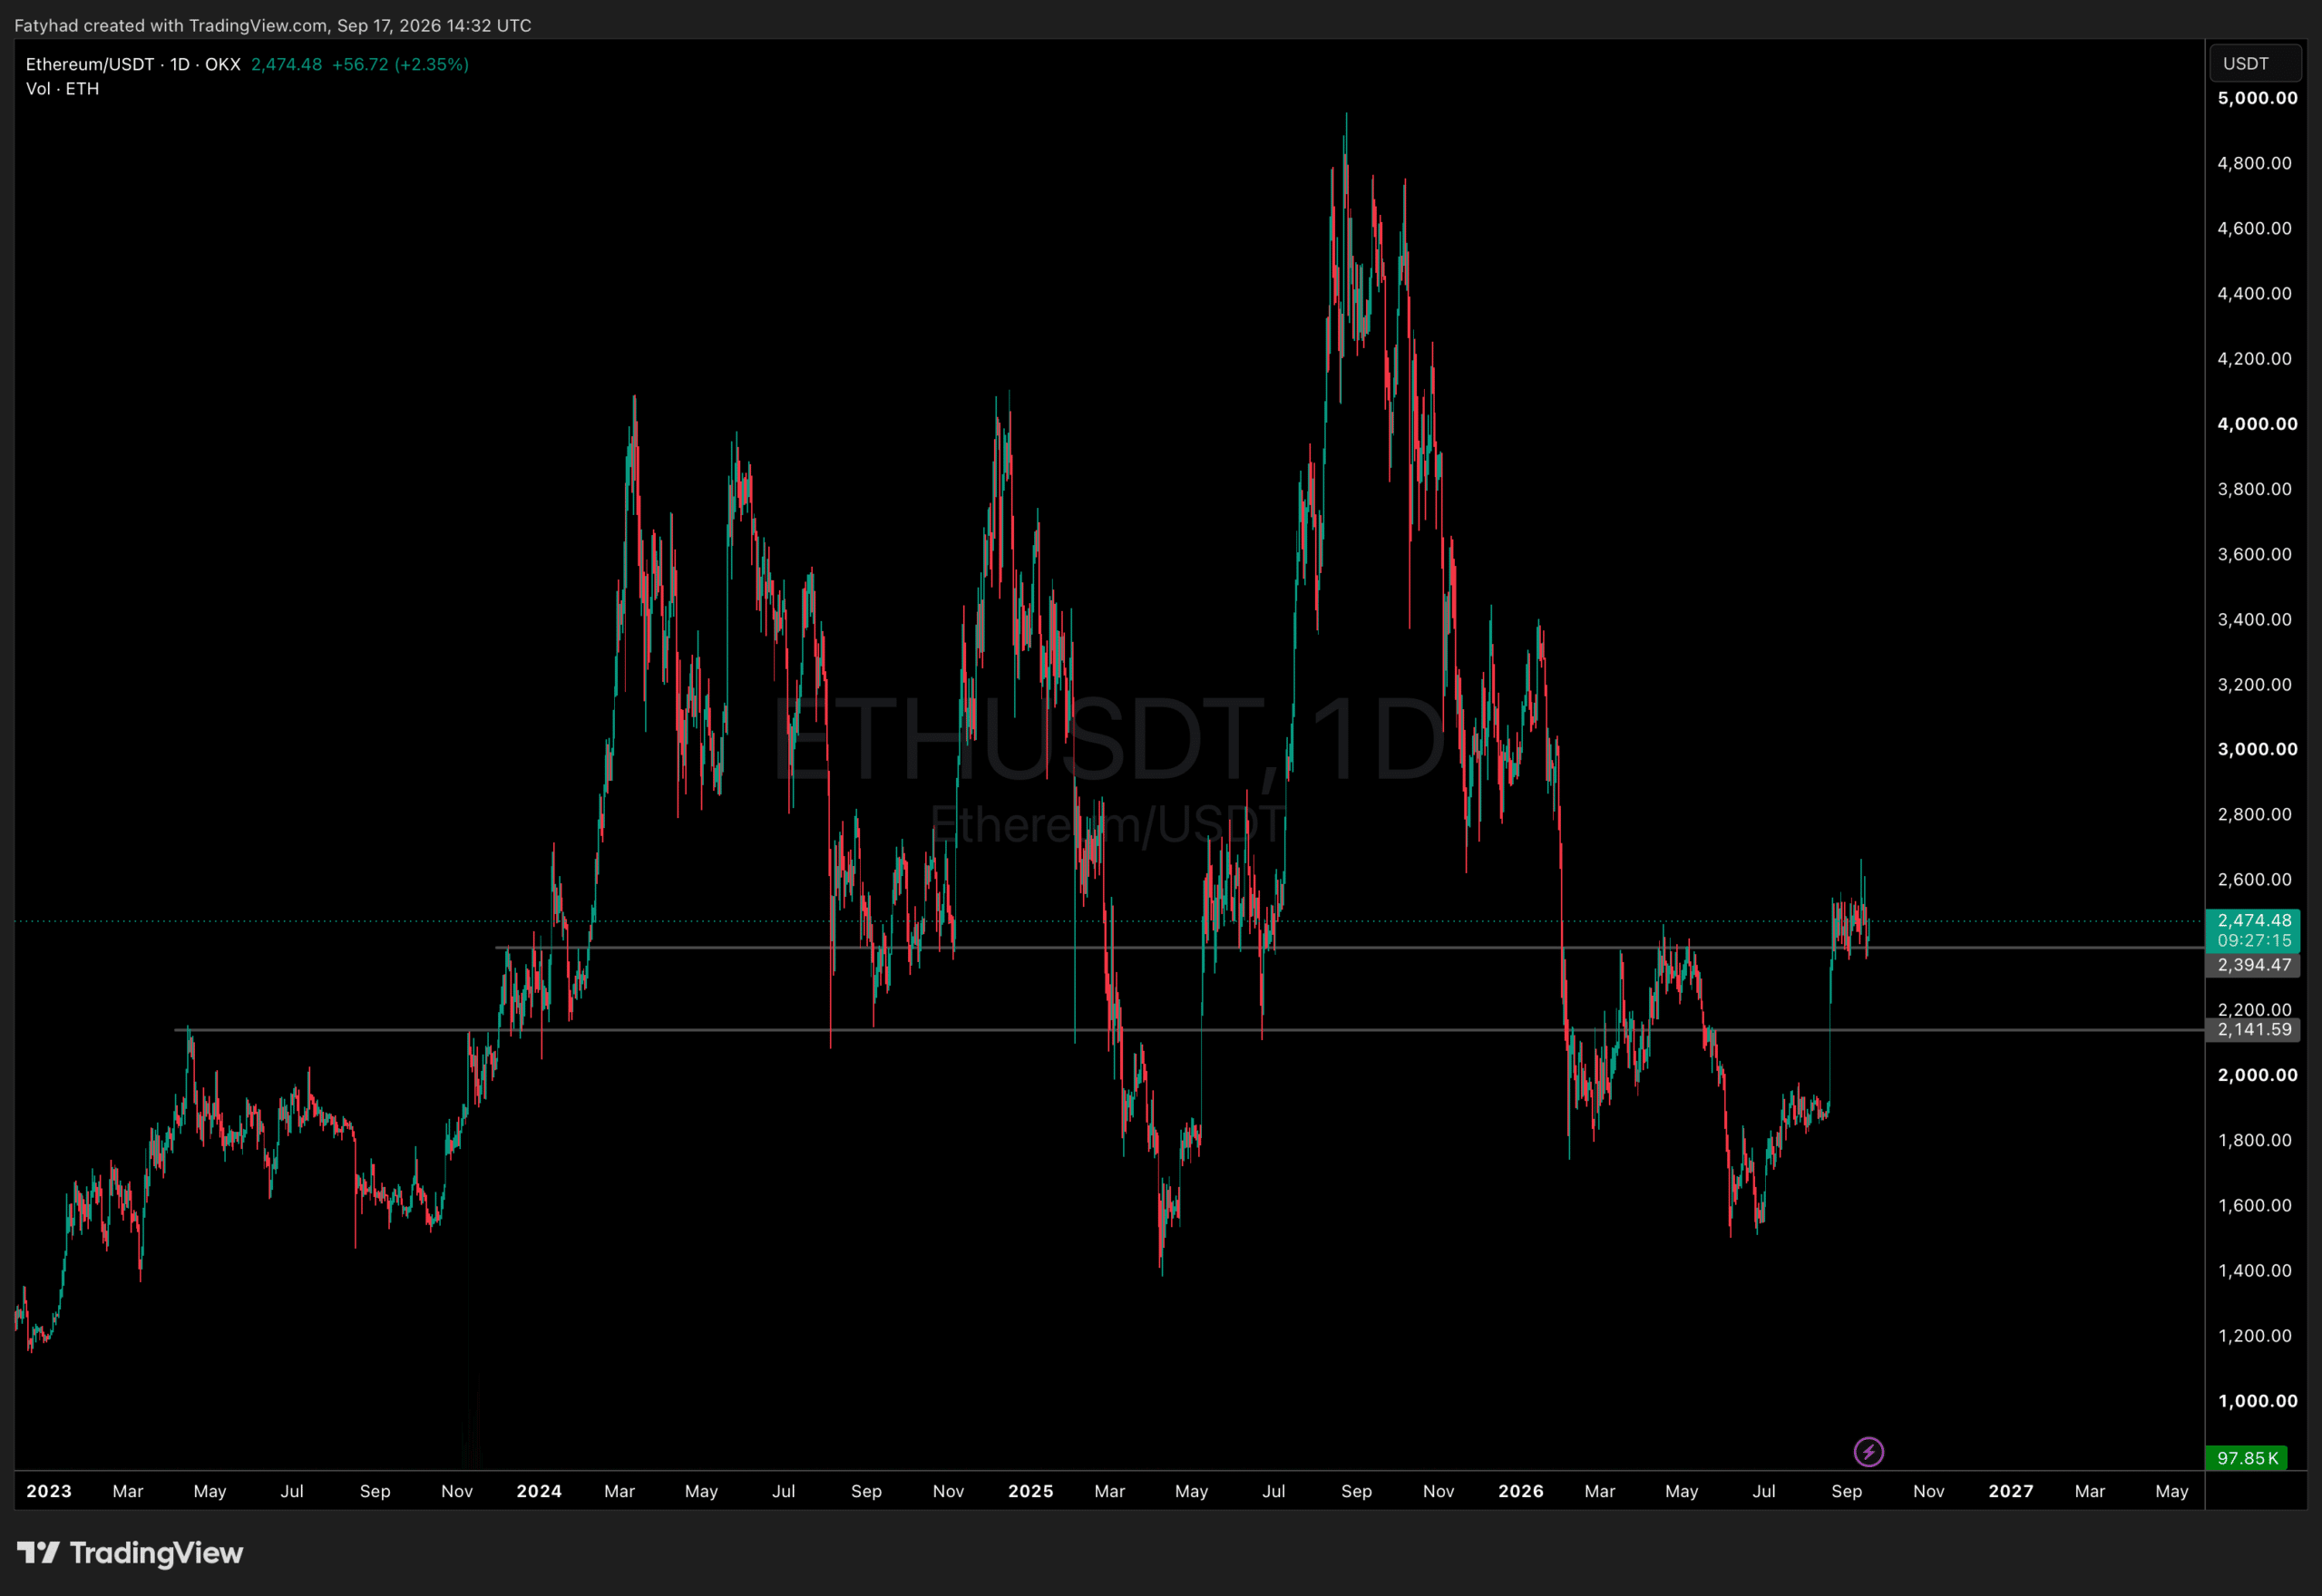
In the latest Ethereum news, ETH has reclaimed both the 20-day Exponential Moving Average and the $2,431 horizontal level, key support zones over the past month. The Stochastic reading of 26 backs the consolidative read from the RSI, suggesting momentum has cooled from prior overbought conditions without collapsing.
Immediate resistance sits at $2,544, with further upside room toward $2,626 and then $2,786 if buyers sustain price above the near-term moving-average band. On the downside, the 50-day and 200-day EMAs at $2,282 and $2,269 form the next support shelf, followed by $2,172, the 100-day EMA at $2,163, and $1,961. Continued momentum context is available in Ethereum’s broader Q3 rebound narrative.
$ETH supply on exchanges is falling sharply while price is going up.
Supply shock incoming? pic.twitter.com/MSUh6GkrVx
— Crypto Rover (@cryptorover) September 17, 2026
How Much Can ETF Selling Hurt ETH’s Rebound? Exchange Outflows Hit a Three-Month High

Ethereum Liquidations Coinglass
Exchange netflow data tracked by CryptoQuant showed outflows exceeding inflows by more than 152,000 ETH on Tuesday, the largest such reading since June, before a brief inflow-dominant stretch on Wednesday gave way to renewed outflows. Net outflows from exchanges are generally read as a sign of accumulation, though the signal is suggestive rather than conclusive on its own.
The Taker Buy Sell Ratio, which measures aggressive buying against selling in perpetual swaps, flipped back positive after briefly dipping below 1, per CryptoQuant.
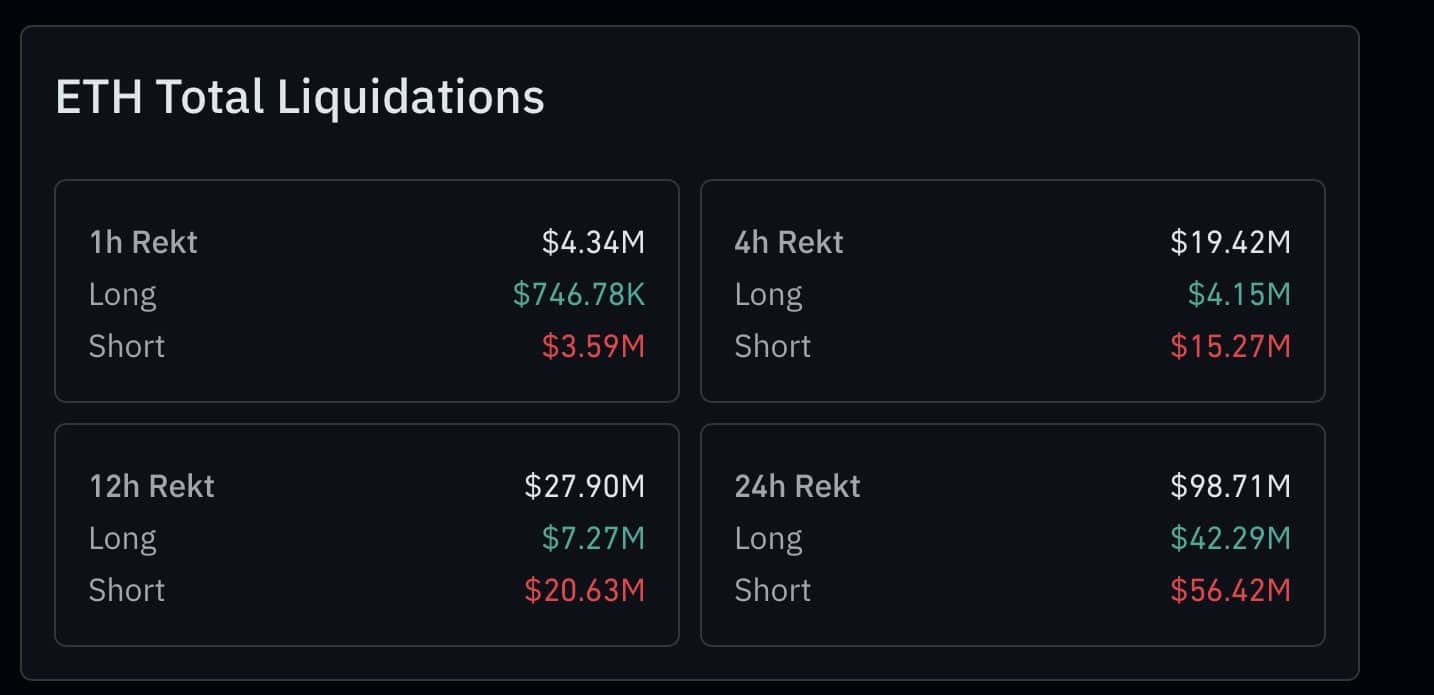
ETH liquidations reached $221 million on Tuesday, with longs accounting for 88%, before falling to $87.6 million over the following 24 hours, led by $45.4 million in short liquidations. Open interest held near 13 million ETH, and funding rates returned to positive territory.
Trade On The Most Trusted Exchange in CryptoEthereum News: ETF Outflows Threaten the Recovery, Making $2,431 the Level That Decides ETH’s Next Move

Ethereum ETF Flows Coinglass
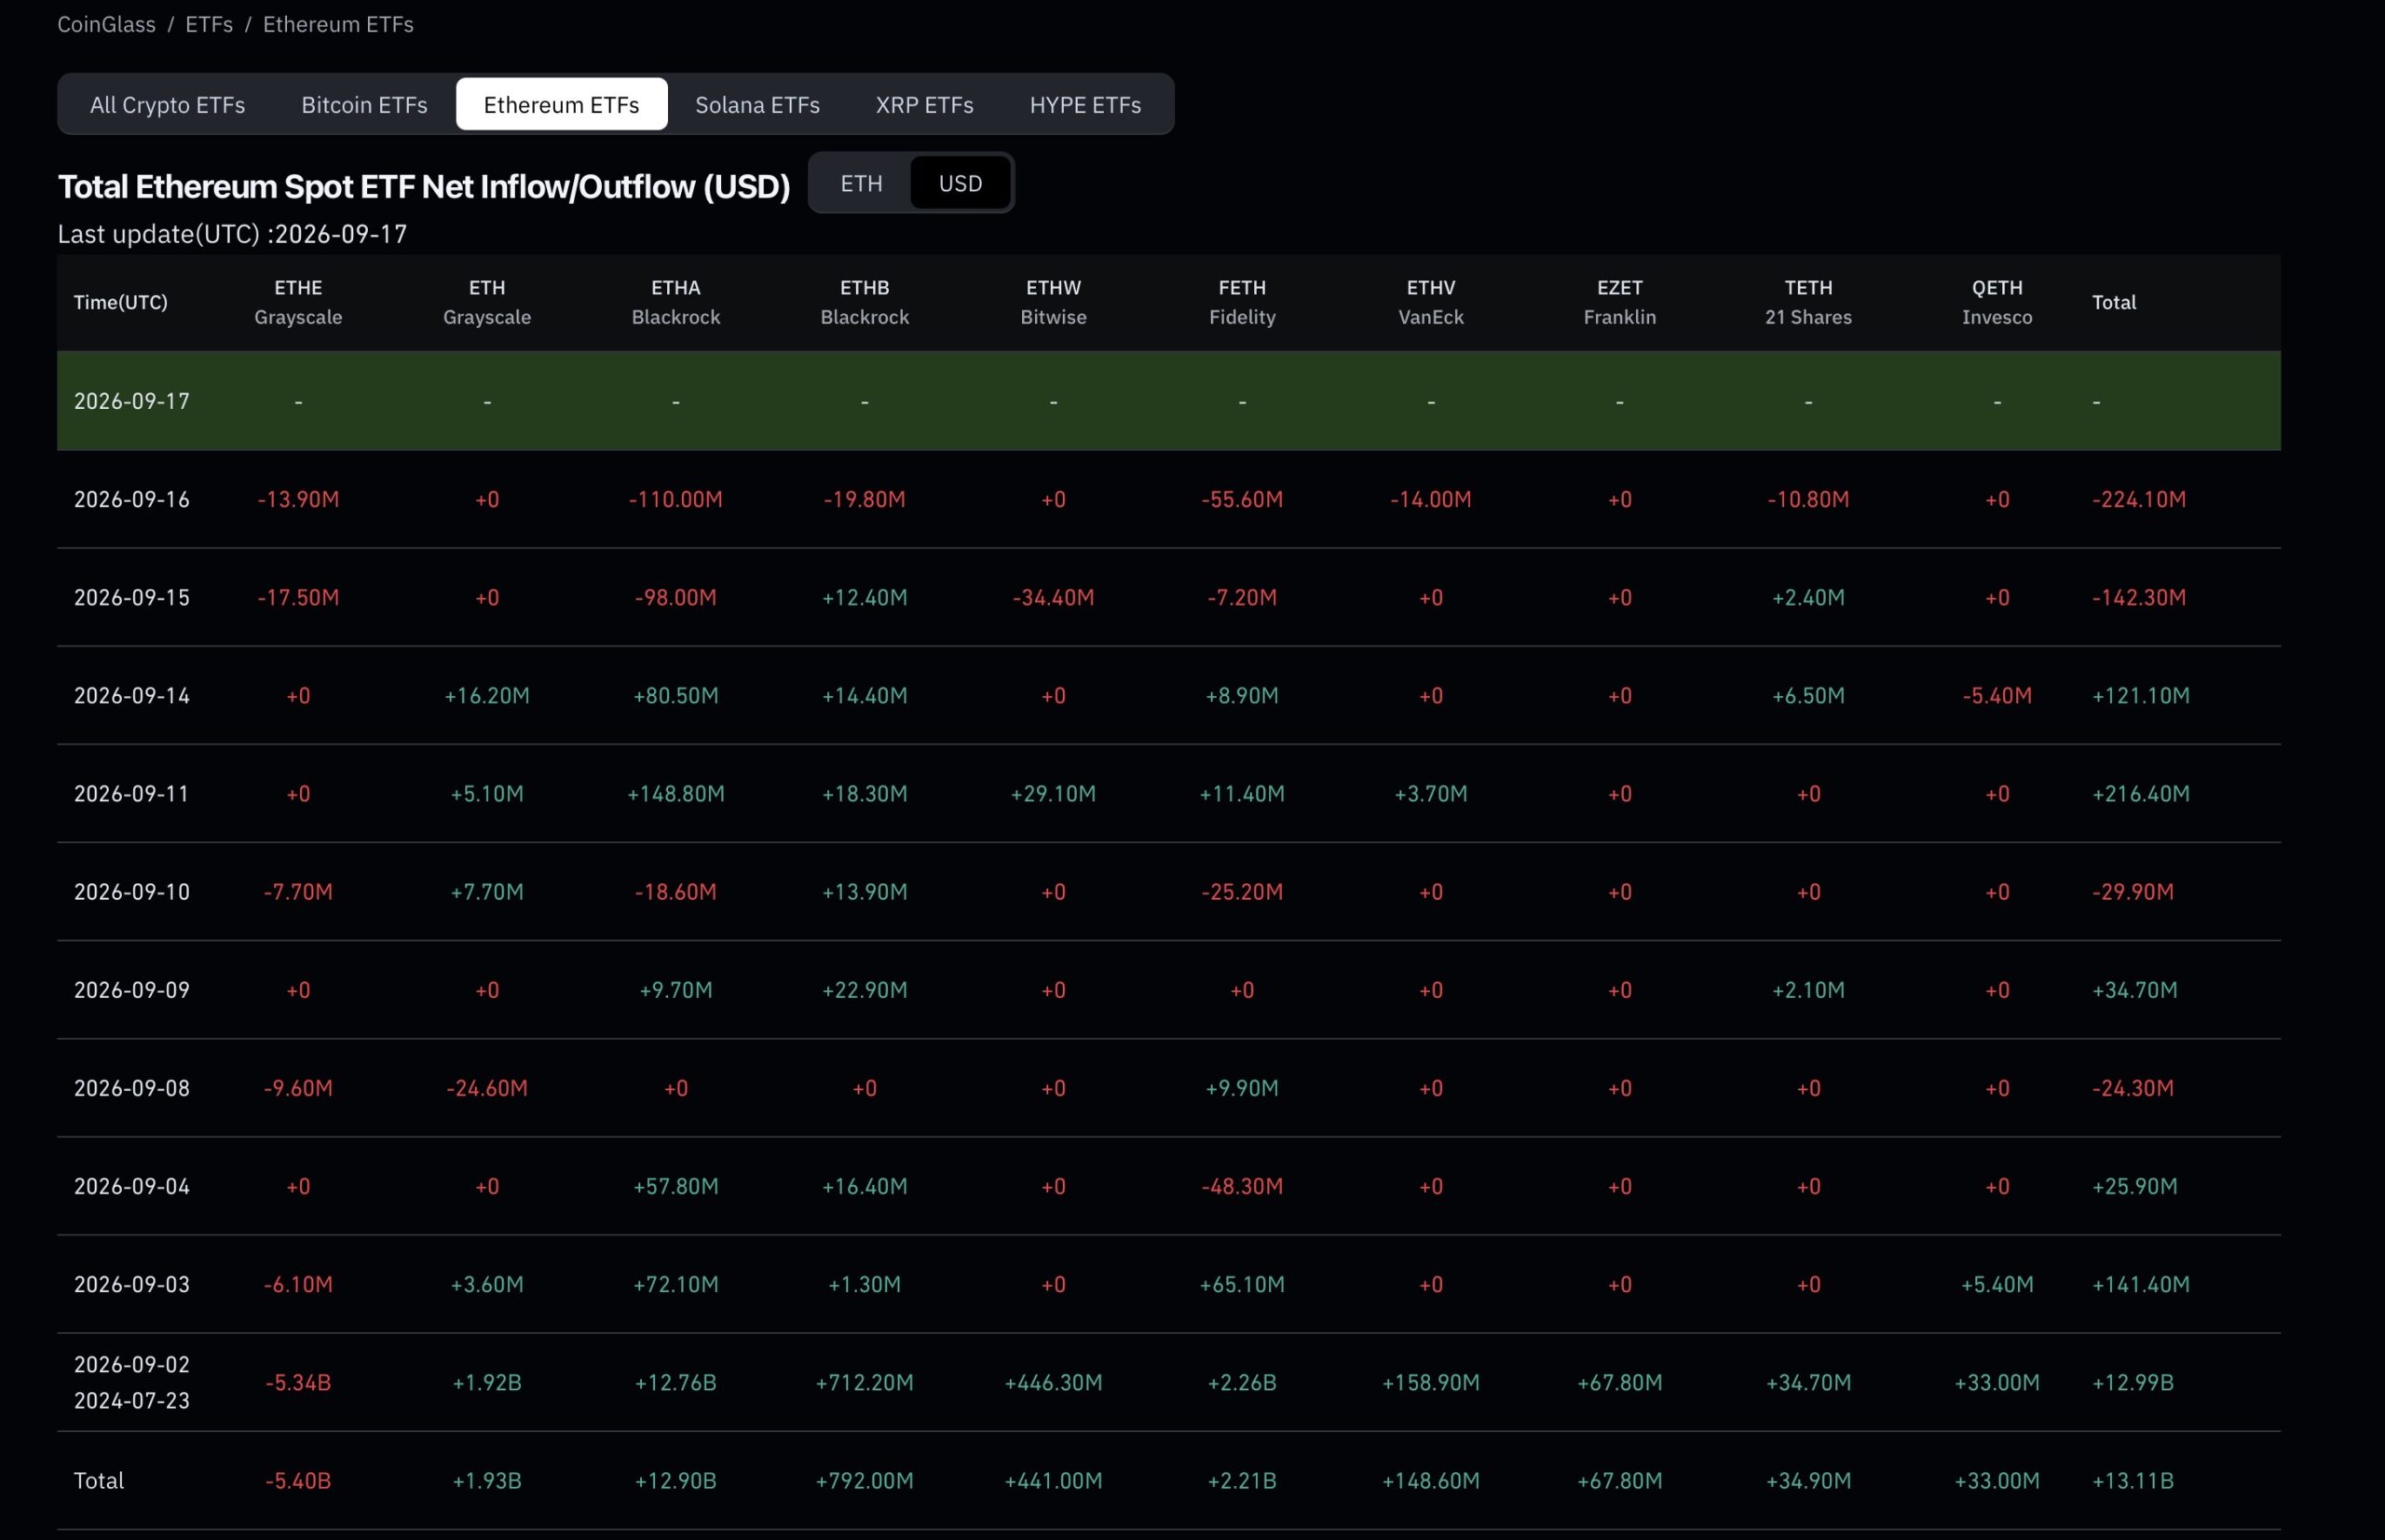
The counterpoint is US spot ETH exchange-traded funds, which shed $224.1 million on Wednesday after $141.4 million in outflows on Tuesday.
Two consecutive negative days that stand in contrast to the resilience visible in derivatives and exchange flows. That pattern echoes broader dynamics discussed in Bitcoin’s own ETF outflow pressure around the Fed decision.
A sustained hold above $2,431 and the 20-day EMA keeps the path open toward $2,544, then $2,626 and $2,786, provided ETF outflows do not accelerate further.
A loss of that $2,431 support, by contrast, would weaken the recovery case and put the $2,282 and $2,269 EMA cluster back in focus, with $2,172, $2,163 and $1,961 as deeper fallback levels should institutional selling persist alongside the current Fed and regulatory backdrop.
Market Intelligence: Crypto Analyst Predicts Best New Crypto to Hodl
next