
Strategy’s mNAV briefly hit 0.99x in June and BTC yield has fallen to 5.8%. Here’s what the Q2 earnings on 31 July mean for Bitcoin price structure and key technical levels.
The Bitcoin price is currently trading around $65,150, down -0.8% in the last 24 hours. The key risk below this price level isn’t macro rates or ETF flows, but rather the upcoming Q2 earnings report from Strategy (MSTR) on July 31.
As the largest publicly traded holder of Bitcoin, the company’s declining metrics could directly impact BTC. In Q1 2026, Strategy reported a $14.5Bn operating loss, driven largely by declining Bitcoin prices, despite software revenue growing to $124.3M.
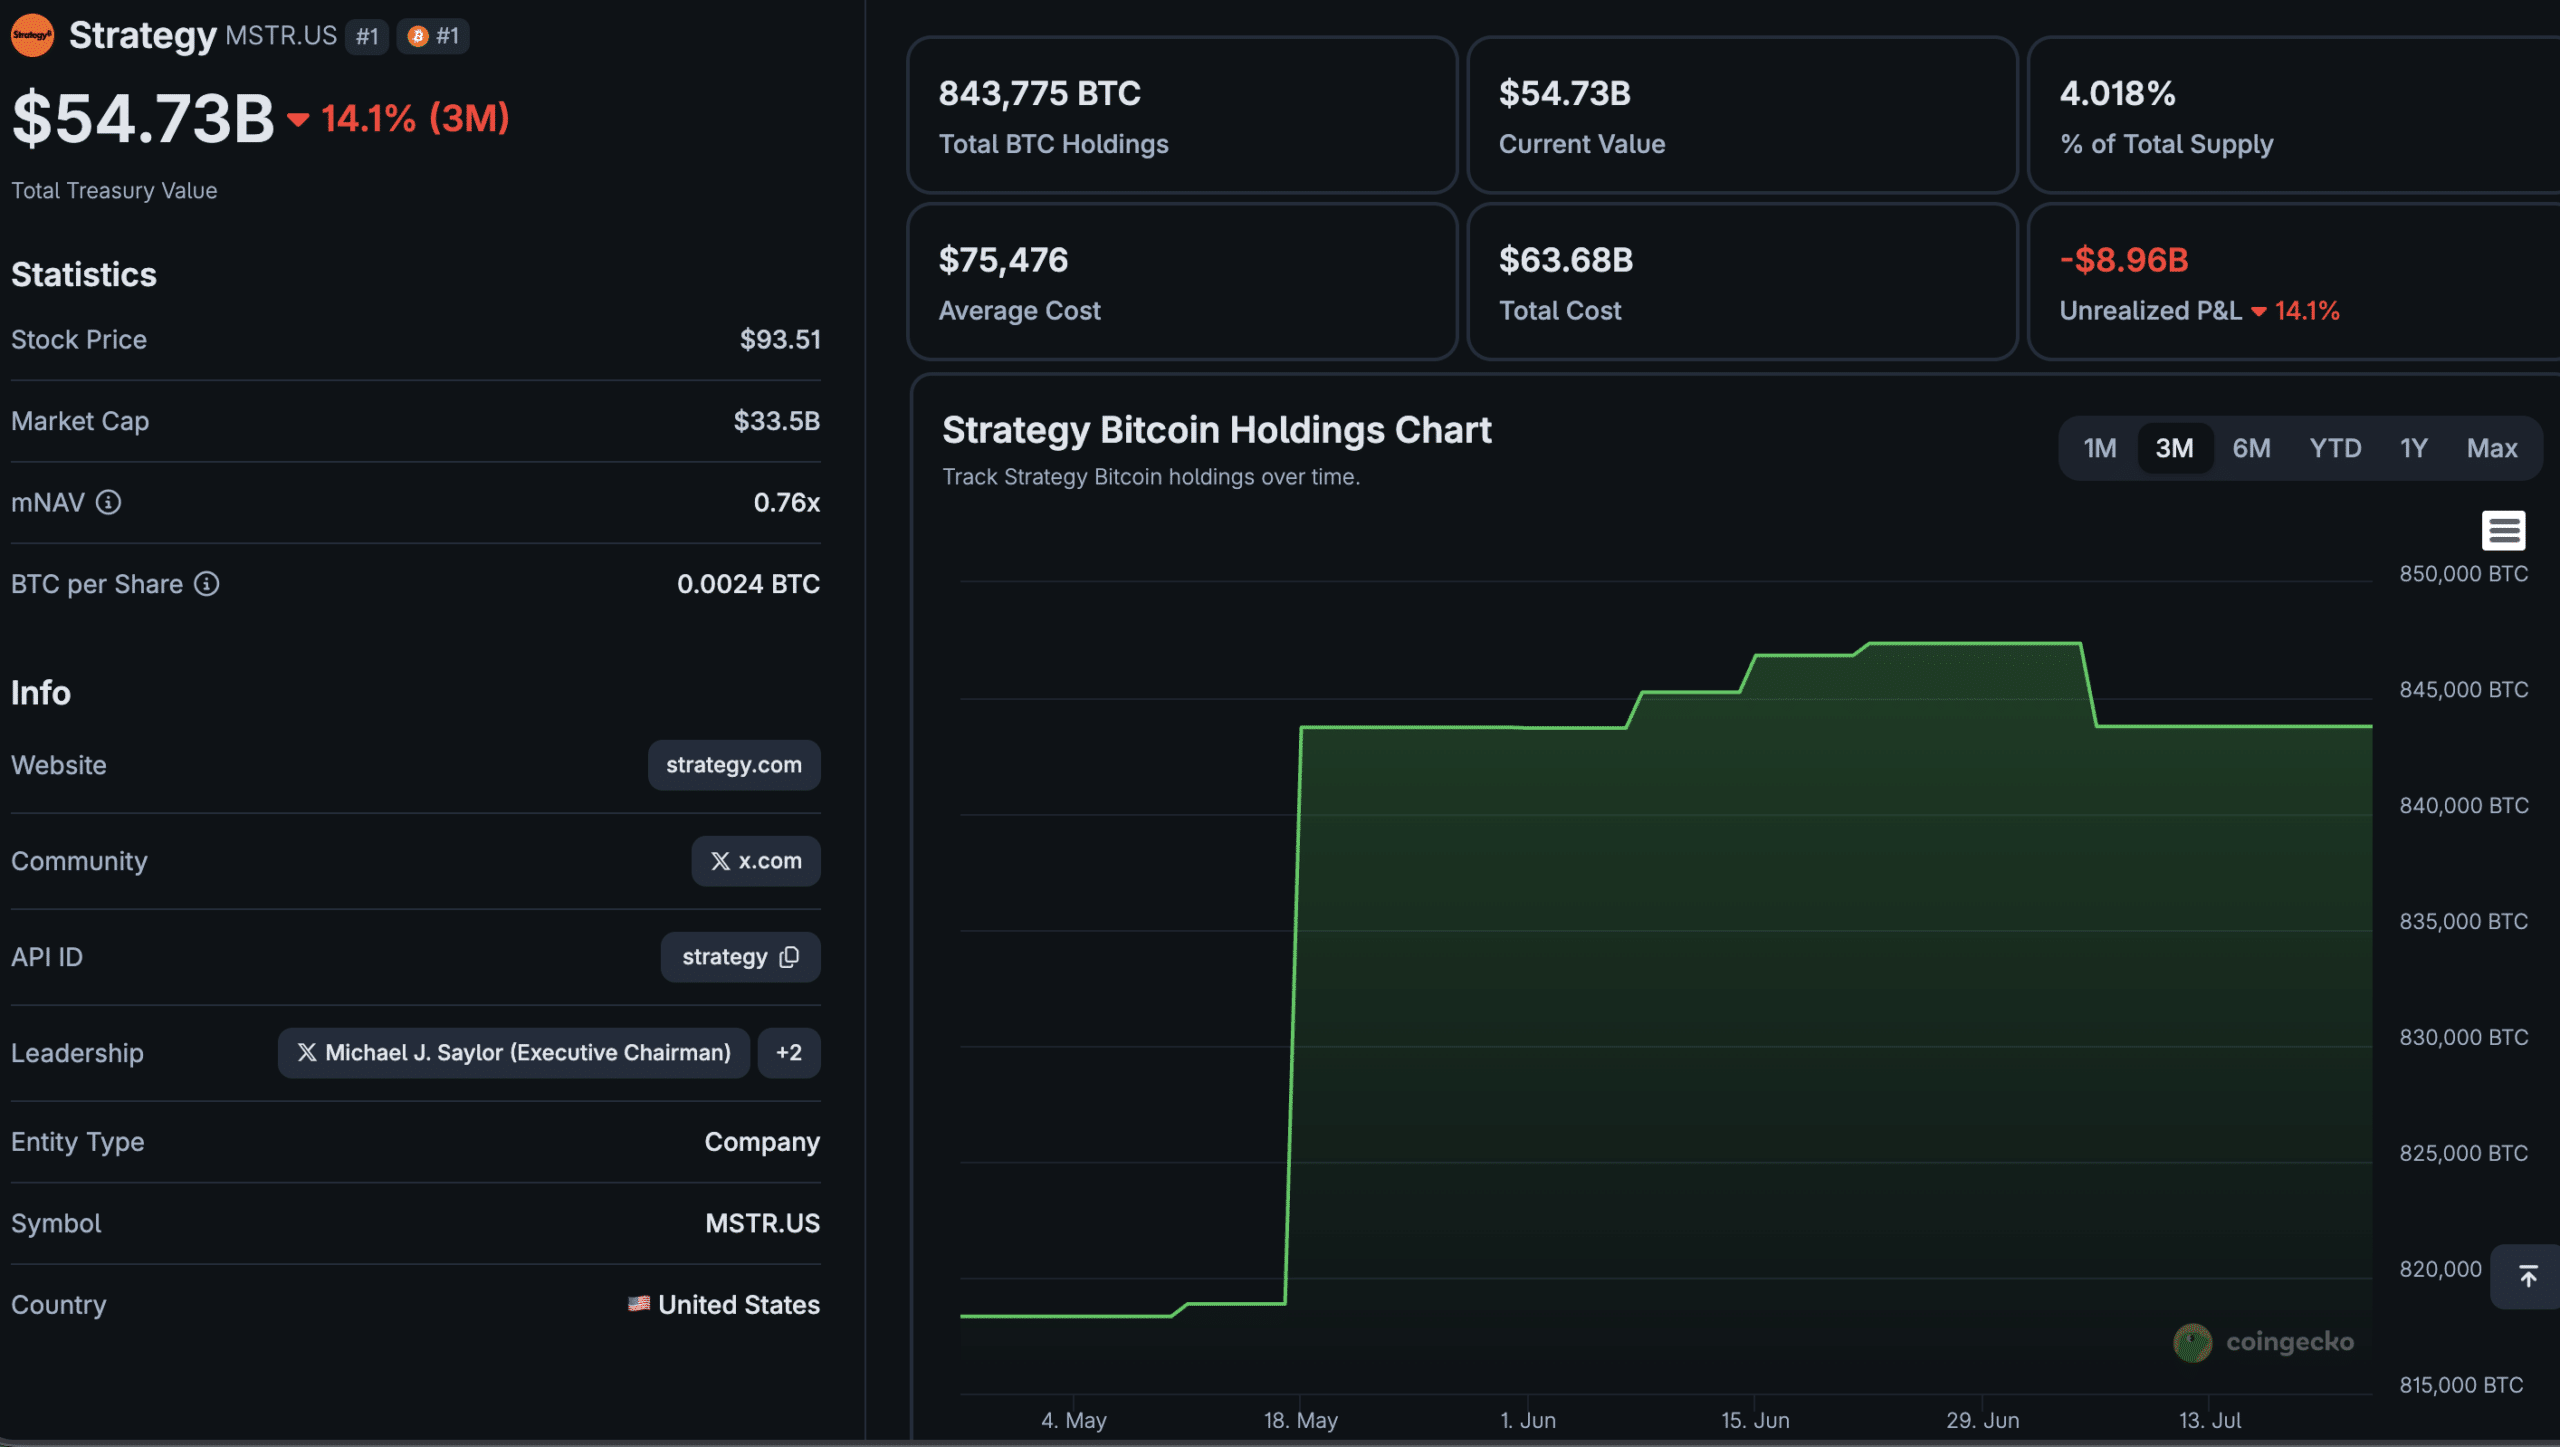

Accretion metrics have worsened, with Bitcoin yield dropping to 5.8% and Bitcoin per share growth declining to 8% year-on-year. The Q2 consensus for the London Stock Exchange Group (LSEG) predicts a $3.86Bn return to operating profit.
This is based on limited analyst estimates and could lead to a downside surprise, especially given Bitcoin’s Q2 decline to around $59,100 from roughly $68,100 at the end of Q1.
Can Bitcoin Price Hold $60,000 as Strategy’s mNAV Risk Builds?
Strategy holds over $51,000,000,000,000 $BTC.
But the company itself is now valued at just $29.5 billion.
For years, investors treated $MSTR like a leveraged Bitcoin ETF.
The model was simple:
Issue more shares → Buy more Bitcoin → BTC goes higher → Investors keep paying a…
— Ted (@TedPillows) June 27, 2026
The $60,000–$61,000 zone is now the critical support band. A decisive break lower opens the path toward the mid-$50,000s, where the next substantive demand cluster sits. Resistance is layered between $66,000 and $68,000, with prior highs above $70,000 representing the upper scenario target.
Three scenarios frame the near-term range:
The bull case: macro data turns supportive, spot Bitcoin ETF (exchange-traded fund) inflows resume, and BTC reclaims the high-$60,000s, Strategy’s mNAV stabilizes above 1.22x, and the accretion model holds.
The base case: Bitcoin price churns in the $60,000–$65,000 range as open interest normalizes, and traders wait on Federal Reserve signals, with mNAV hovering just above parity.
The bear case: $60,000 fails, mNAV slips back toward or below the 0.99x trough it touched in late June, and the prospect of Strategy being forced to sell BTC introduces genuine structural sell pressure.
That last scenario is the one most traders have underpriced. When mNAV sits below 1.22x, management’s own stated breakeven once debt and preferred stock are factored in, every share issuance destroys rather than creates value, and the buying pressure Strategy has historically provided to Bitcoin evaporates.
The model that has made MSTR a leveraged BTC proxy only works with a premium. Without it, Strategy becomes a holder rather than an accumulator, a subtle but consequential shift for market structure.
EXPLORE: Best Meme Coins to Buy in July
Bitcoin Hyper Targets Infrastructure Upside While Spot BTC Stalls

Traders watching the Bitcoin price range while Strategy’s structural support fades are increasingly looking to earlier-stage exposure across the Bitcoin stack, where upside potential is asymmetric, and price action is decoupled from spot BTC volatility.
Bitcoin Hyper ($HYPER) is positioning itself at that infrastructure layer, specifically as the first Bitcoin Layer 2 with Solana Virtual Machine (SVM) integration, targeting sub-second finality and low-cost smart contract execution while preserving Bitcoin’s underlying security model.
The project addresses Bitcoin’s core constraints- slow throughput, high fees, and limited programmability- through a Decentralized Canonical Bridge for BTC transfers and SVM-based execution that the team claims outperforms Solana itself in transaction latency.
The presale has raised $32,977,147.17 at a current token price of $0.0136835, with staking available for participants.
Visit the Bitcoin Hyper Presale Website Here.
DISCOVER: Best Meme Coins to Buy in 2026
next